Part 3 – PASCO PS-2138 Goniometer User Manual
Page 20
Goniometer
Experiment Teachers' Notes and Sample Data
20
®
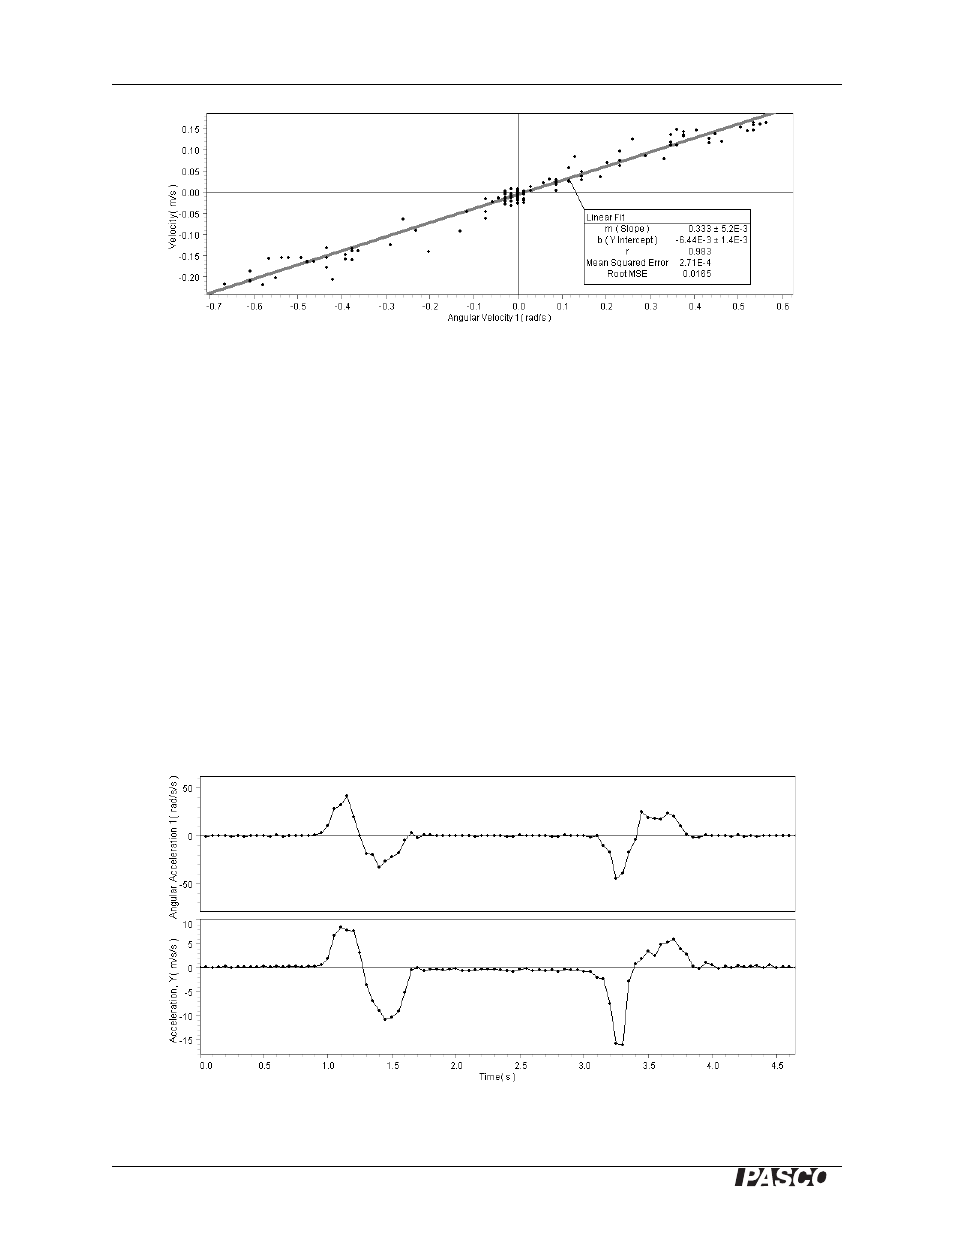
2) The graph of Velocity vs. Angular Velocity shows a directly
proportional, linear relationship.
3) In this example slope = 0.333 m ± 0.005 m
4) v
T
= slope ×
ω
v
T
= (0.333 m)
ω
This equation supports the prediction.
5) Slope is r, the distance from the elbow to the hand. In this case the
actual value of r is 0.36 m. The theoretical value (from slope) and
actual value (from direct measurement) differ by about 8%.
Note that the directly measured values of r in Part 1 and Part 2 are
slightly different, though they are from the same student. This is due to
the different hand positions used in each part.
Part 3
Students should predict a
T
= r
α
1) The graphs of Angular Acceleration vs. Time and Tangential
Acceleration vs. Time appear to be directly proportional.