Typical glx procedures – PASCO PS-2175 GPS Position Sensor User Manual
Page 7
®
M o d e l N o . P S - 2 1 7 5
T y p i c a l G L X P r o c e d u r e s
7
Typical GLX Procedures
For complete instructions on using the GLX to collect, display, and analyze data, refer to the
Xplorer GLX Users’ Guide.
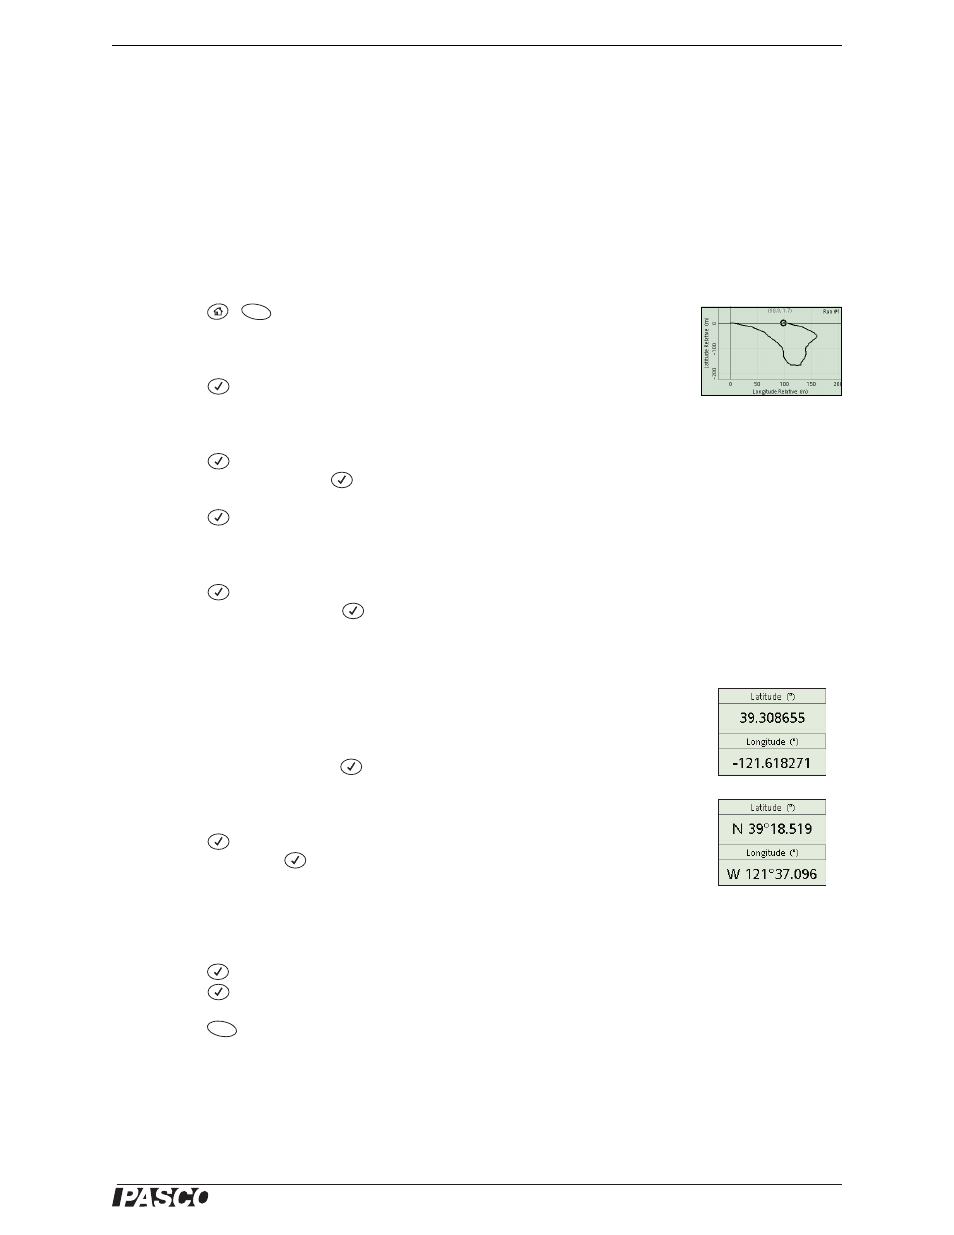
Display Relative Displacement in a Graph
The Latitude Relative and Longitude Relative measurements are the north-south
and east-west displacements (in meters) from your starting point. The starting point is
reset every time you start data recording. Follow these steps to plot Latitude Relative
versus Longitude Relative.
1.
Press
,
to open the Graph display.
By default, the Graph appears with Latitude versus time.
2.
Press .
The Graph’s active areas light up with Latitude highlighted.
3.
Press
to open the data source menu. Use the arrow keys to highlight
Latitude Relative. Press
.
4.
Press
to light up the Graph’s active areas again.
5.
Press the down arrow key to highlight time.
6.
Press
to open the data source menu. Use the arrow keys to highlight
Longitude Relative. Press
.
Display Data in Degrees and Minutes
Follow these steps to display Latitude and Longitude in degrees and minutes with “N”
or “S” to indicate north or south of the equator and “E” or “W” to indicate east or west
of the prime meridian.
1.
In the Digits display, press
to light up the active areas.
2.
Use the arrow keys to highlight Latitude.
3.
Press
to open the data source menu. Use the arrow keys to highlight Data
Properties. Press
.
The Data Properties box opens.
4.
Use the down arrow key to highlight Numeric Style.
5.
Press
to open the menu. Use the arrow keys to highlight NSEW 000°00.000.
Press .
6.
Press
(OK).
7.
Repeat steps 1 through 6 for Longitude.
Relative displacement
graph
F1
Position displayed in
default style (top)
and in degrees and
minutes (bottom)
F1