Atec Rohde-Schwarz-EB500 User Manual
Page 17
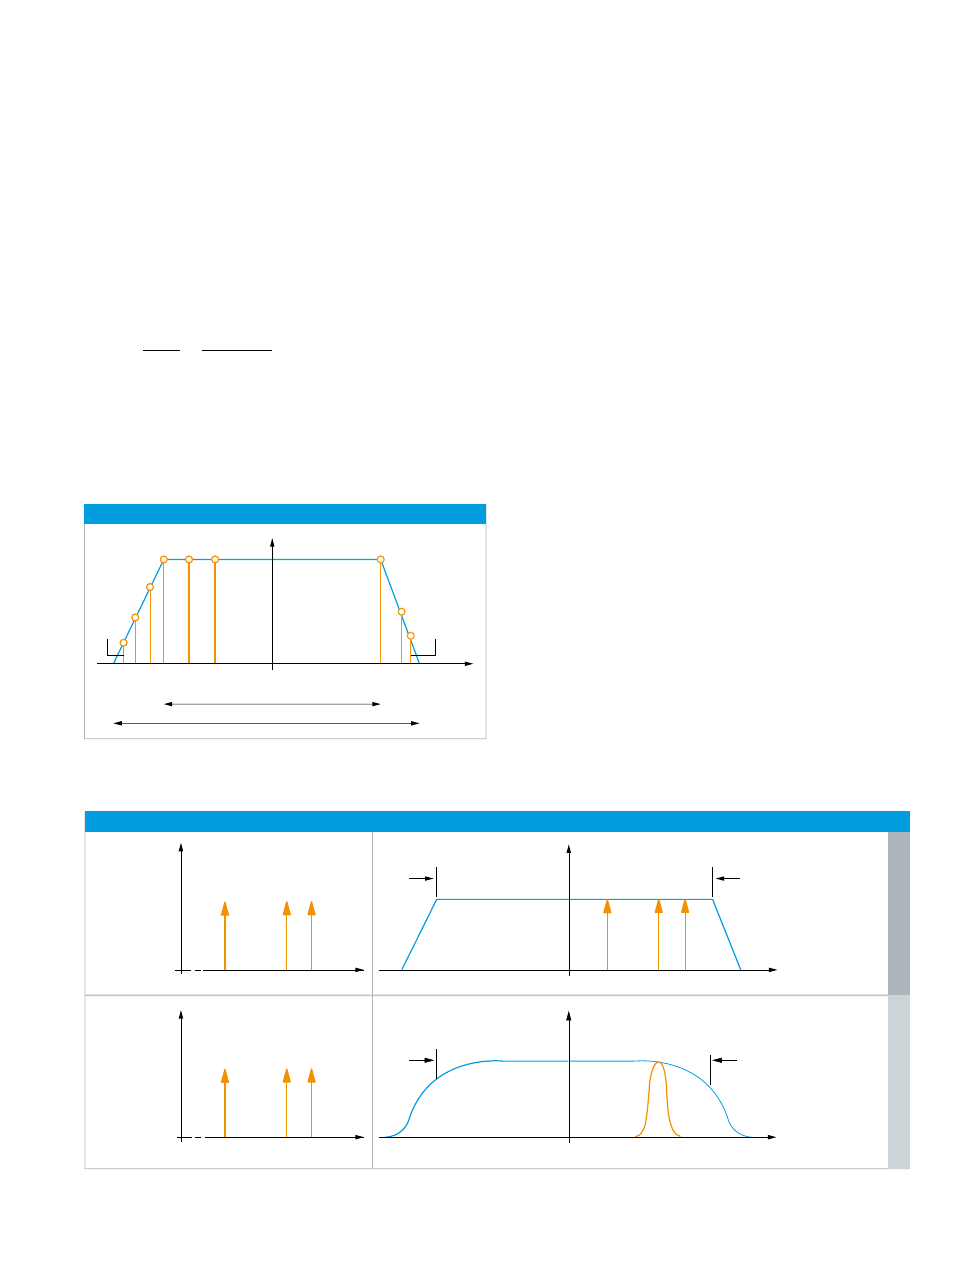
Signal processing for IF spectrum
n = 1
n = 4096
f
RX
Frequency in MHz
a in dBµV
25.6 MHz
20 MHz
Signal display in IF spectrum
Analog
Digital
Input signal
Input signal
IF spectrum
IF spectrum
f
IF
bandwidth
a
f
1
f
f
3
f
2
IF
bandwidth
f
sum
a
f
1
f
3
f
2
f
1
f
f
3
f
2
a
a
f
Rohde & Schwarz R&S®EB500 Monitoring Receiver 17
displayed noise level (DNL) in accordance with the for
mula below (the effect of the window function (Blackman
window) of the FFT is not considered here for simplicity’s
sake):
DNL = –174 dBm + NF + 10 × log(BW
bin
/Hz)
The quantity NF represents the overall noise figure of the
receiver.
The above example shows that, due to the use of the FFT,
the actual resolution bandwidth (RBW) to be taken into ac
count in DNL calculation is clearly smaller (i.e. BW
bin
) than
would be expected for the wide (unscanned) display range
of 20 MHz.
Another advantage of the high spectral resolution used in
the FFT calculation is that signals located close together
(e.g. f
1
, f
2
and f
3
) can be captured and represented in the
IF spectrum as discrete signals (see figure “Signal display
in IF spectrum”).
If, on an analog receiver, a resolution bandwidth equal to
the set IF bandwidth were selected (RBW = BW
IF spectrum
),
a sum signal f
sum
would be displayed instead of the three
discrete signals f
1
, f
2
and f
3
.
Actual sampling bandwidth compared with selected IF bandwidth.
Signal resolution in IF spectrum in digital and analog receiver concept.
For an IF bandwidth of BW
IF spectrum
= 20 MHz, the con
stant has a value of 1.28. Therefore, to display a 20 MHz
IF spectrum, a sampling rate of f
S
= 25.6 MHz is required.
The R&S®EB500 uses a maximum FFT length N of
4096 points to generate the IF spectrum. To calculate
these points, the 25.6 MHz sampling band in the above
example is divided into 4096 equidistant frequency slices,
which are also referred to as bins (see figure “Signal
processing for IF spectrum”).
The bandwidth BW
bin
of the frequency slices is obtained as
follows:
This means that in the above example only the calculated
bandwidth of 6.25 kHz for each bin has to be taken into
account as the noise bandwidth in the calculation of the
f
s
BW
Bin
6.25 kHz
4096
25.6 MHz
4096
=
=
=