Atec JDSU-ONT Series User Manual
Page 15

ONT-5xx 40/43 Gb/s Test Solution
15
Graphical display
Display of all events as bar graphs versus time. Cursors allow easy
identification and zooming (in and out) on results. Filters enable
event selection.
Time axis
Second, minute, hour
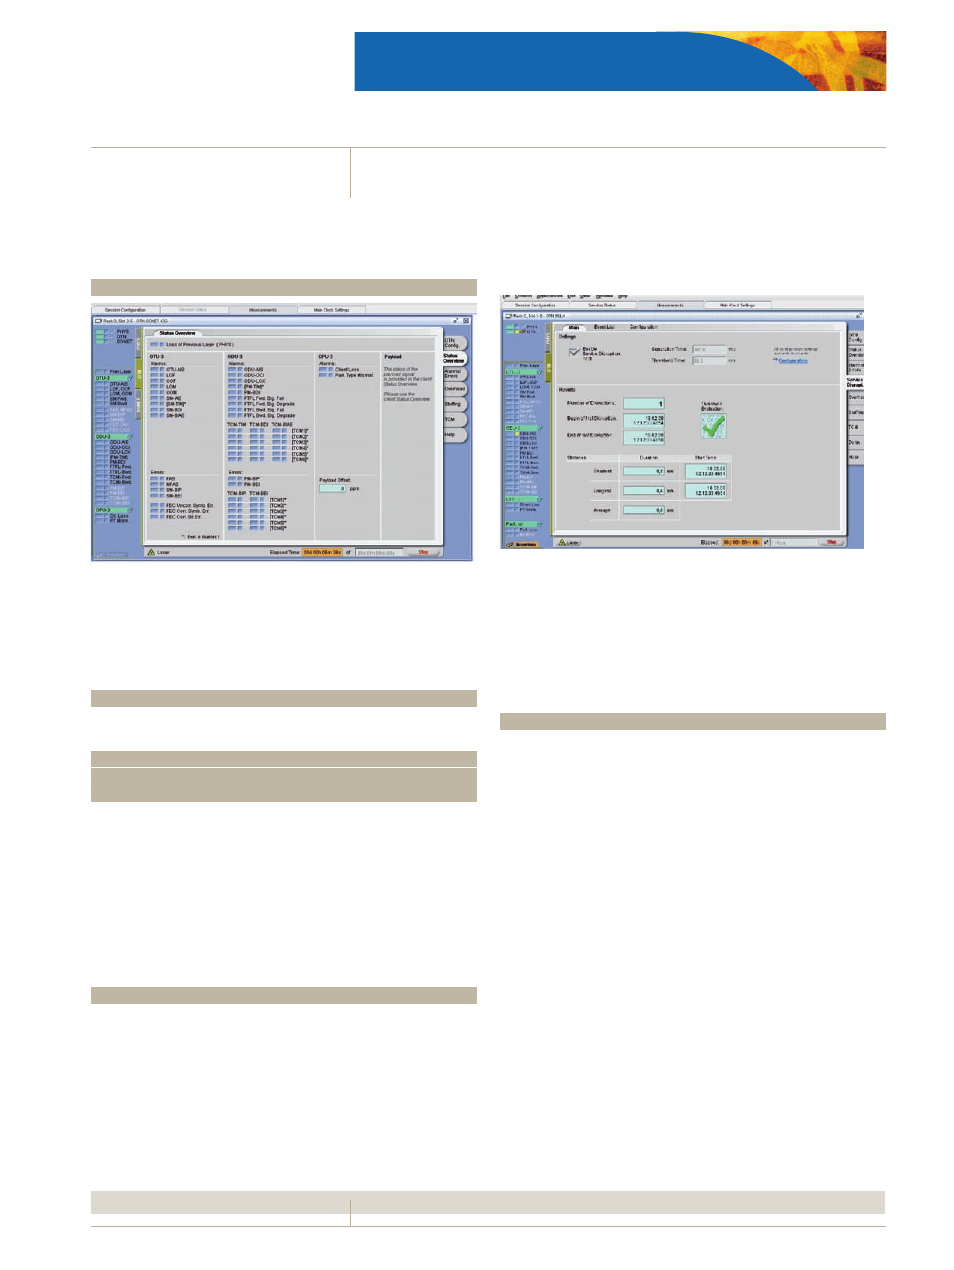
Service disruption test
To analyze service disruption times, the ONT-5xx generates a high-
speed event list as a result of all detected events.
Sensor to trigger service disruption test, selectable:
Errors
Types
MFAS, SM-BEI, PM-BIP, PM-BEI, payload errors
Event sample resolution
100 µs
Alarms
Types
LOS, LOM, OOM, SM-IAE, SM-BDI, SM-BIAE, ODU-AIS,
ODU-OCI, ODU-LCK, PM-BDI
Separation time
0.1 ms to 100000 ms
Separation time starts at the end of the last event. Separation time
is used to determine if the following event is a continuation of the
same disruption (event occurs within separation time) or the start
of the next disruption (event occurs after separation time has
elapsed).
Result display of disruptions
Numerical display
Total Number of disruptions, begin timestamp of first disruption,
end timestamp of last disruption,
Shortest disruption time (with timestamp)
Longest disruption time (with timestamp)
Average disruption time
The threshold to identify a violation of allowed service disruption
time can be set in the range of 0 ms to 100000 ms
Tabular display:
Service disruption events with start/stop times and duration.
Three logging modes available (no logging; disruption events only;
disruption and causing sensor events)
Transfer delay analysis
Transfer delay measurements by special payload pattern in the
range of 0 to 40 s.
Transfer delay can be measured even between different ports
within the same mainframe.
Numerical display
Current transfer delay with accuracy of 1 µs and resolution 100 ns
Minimum transfer delay (with timestamp)
Maximum transfer delay (with timestamp)
