System specifications and characteristics, Video bandwidth – Atec Agilent-8990B User Manual
Page 14
14
System Specifications and Characteristics
Average power measurement accuracy
N1923A
≤ ±0.2 dB or ±4.5 %
1
N1924A
≤ ±0.3 dB or ±6.7 %
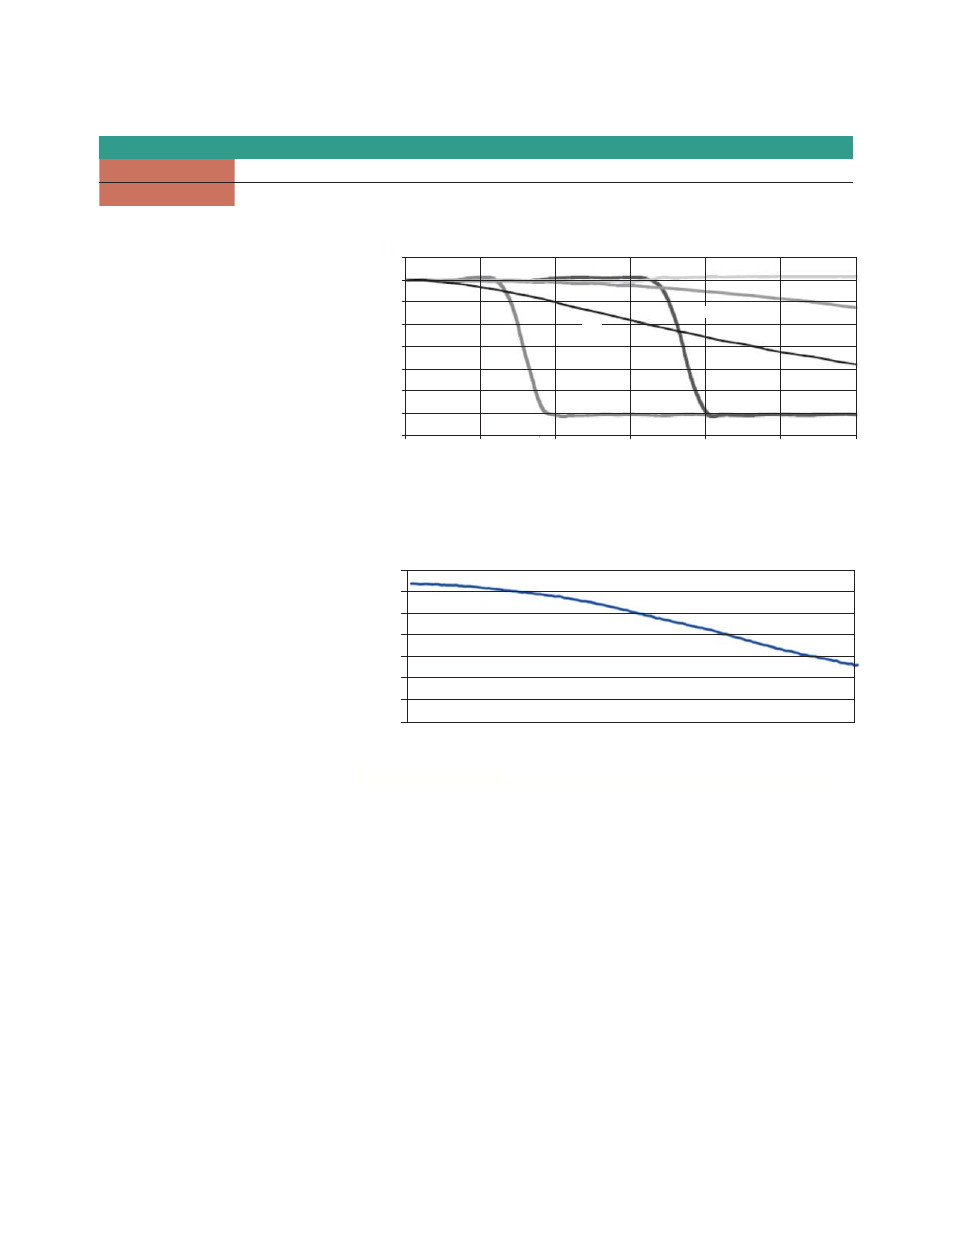
Figure 1. Flatness Response
Video bandwidth
The video bandwidth in the peak
power analyzer can be set to High,
Medium, Low and Off. The video
bandwidths stated in the table below
are not the 3 dB bandwidths, as the
video bandwidths are corrected for
optimal flatness (except the Off filter).
Refer to Figure 1 for information
on the flatness response. The Off
video bandwidth setting provides
the warranted rise time and fall time
specification and is the recommended
setting for minimizing overshoot on
pulse signals.
0.5
0.0
–0.5
–1.0
–1.5
–2.0
–2.5
–3.0
–3.5
Error (dB)
0 5 10 15 20 25 30
Medium
High
Off
(> 500 MHz)
Off
(< 500 MHz)
Low
Input tone separation frequency (MHz)
1. Specification is valid over a range of –15 to +20 dBm, and a frequency range of 0.5 to 10 GHz, DUT Max. SWR < 1.27 for the N1923A, and a frequency
range of 0.5 to 40 GHz, DUT Max. SWR < 1.2 for the N1924A. Averaging is set to 32.
Figure 2. Video Bandwidth set to Off
Peak to average (dB)
Tone separation (MHz)
3.5
3
2.5
2
1.5
1
0.5
0
–10 10 30 50 70 90 110 130 150