8 processing measurement data, 1 querying data, Processing measurement data – Xylem WQL-pH pH DATALOGGERS User Manual
Page 53: Querying data, 8processing measurement data
WQL-pH
Processing measurement data
127
ba75821e01
10/2009
8
Processing measurement data
8.1
Querying data
The data recorded by the logger and stored in the database can be displayed
as a graphic via the Query menu item. Proceed as follows:
Querying current
data
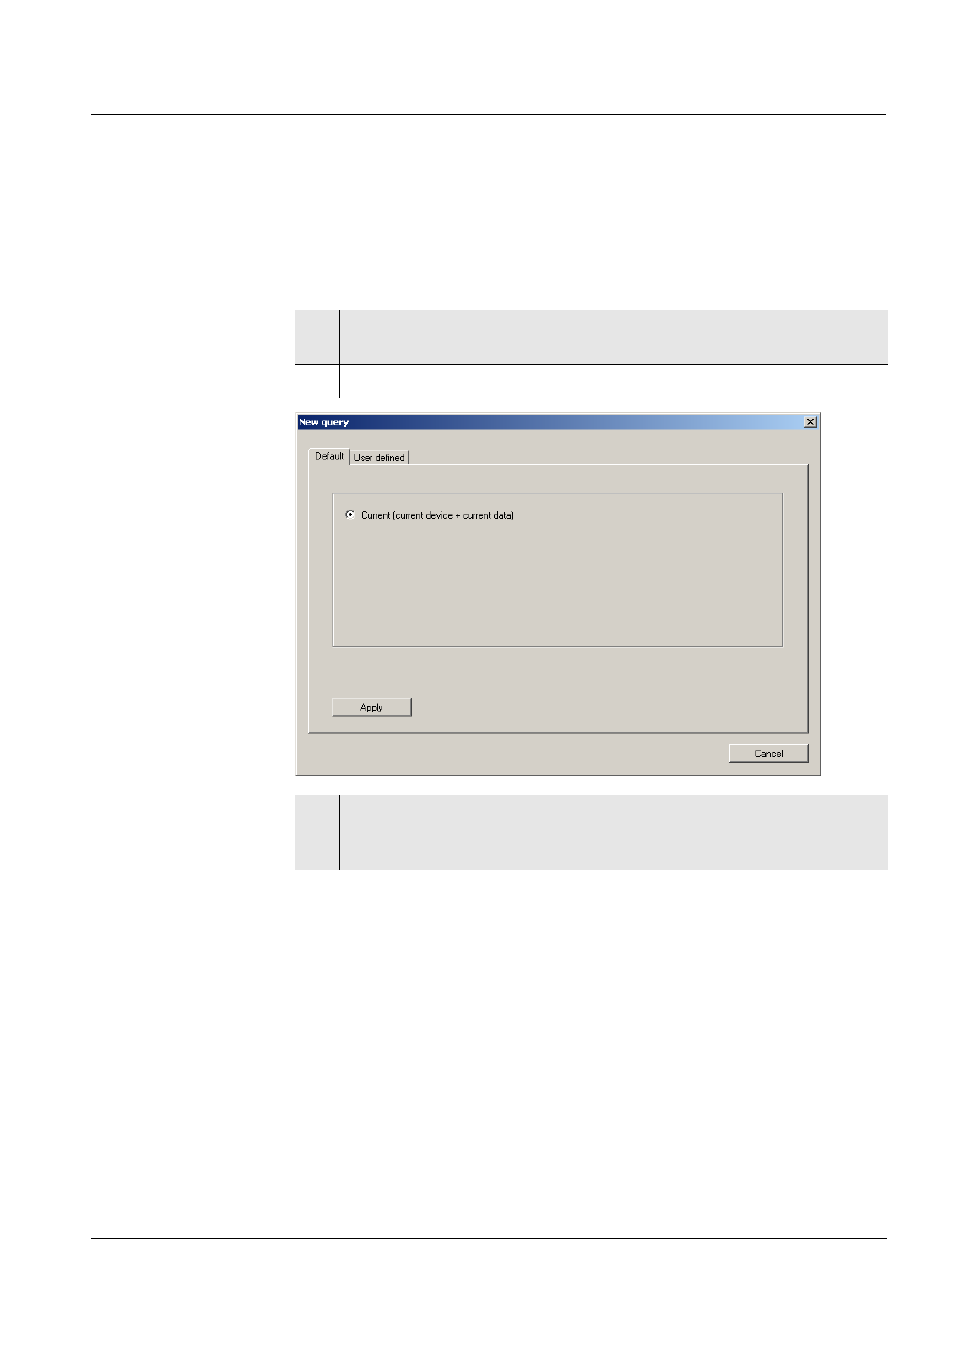
1
In the Query menu, click the menu item, New.
The New query window appears.
2
The Standard tab appears when a logger is connected.
3
To graphically display the data last imported from the connected
logger, click Apply. The data appear as a graphic, broken according
to pH value or voltage value and temperature.
See also other documents in the category Xylem Tools:
- Lab 850 BENCHTOP pH METER (73 pages)
- Lab 850, up to serial number 09470314 (61 pages)
- Lab 860 BENCHTOP pH METER (74 pages)
- Lab 870 BENCHTOP pH METER (71 pages)
- Lab 960 (77 pages)
- Lab 970 (71 pages)
- CG 839 (8 pages)
- CG 842 (44 pages)
- CG 843P (72 pages)
- CG 843 (68 pages)
- CG 853P (76 pages)
- CG 853 (74 pages)
- CG 855 (11 pages)
- HandyLab 100 QuickStart (50 pages)
- HandyLab 100 (66 pages)
- HandyLab 200 QuickStart (50 pages)
- HandyLab 200 (52 pages)
- HandyLab 600 QuickStart (50 pages)
- HandyLab 600 (72 pages)
- HandyLab 680 QuickStart (50 pages)
- HandyLab 680 (120 pages)
- HandyLab 700(EX) (128 pages)
- HandyLab 700 (76 pages)
- HandyLab 780 (164 pages)
- handylab LF 11 (44 pages)
- handylab LF 12 (64 pages)
- handylab OX 12 (60 pages)
- handylab multi 12 (82 pages)
- handylab pH 11 (48 pages)
- handylab pH 12 (68 pages)
- handylab pH LF 12 (80 pages)
- IQ SensorNet FDO 70x IQ (SW) (48 pages)
- IQ SensorNet ViSolid 700 IQ (SW) (58 pages)
- MultiLab 4010-2 (112 pages)
- MultiLab 4010-3 (112 pages)
- EBI 40 TK-12 (18 pages)
- TFX 410 (38 pages)
- EBI 20 Serie (20 pages)
- EBI20 TEMPERATURE/HUMIDITY DATALOGGERS (40 pages)
- EBI 20-TF (40 pages)
- TFX 422 (36 pages)
- ST 1000 (42 pages)
- TLC 1598 (2 pages)
- TTX 100/110/120 (28 pages)
- EBI 25 (18 pages)