Transient voltage suppression diodes, Surface mount – 500w > sacb series, Electrical characteristics – Littelfuse SACB Series User Manual
Page 2: Ratings and characteristic curves, Figure 4 - ac line protection application
Transient Voltage Suppression Diodes
© 2014 Littelfuse, Inc.
Specifications are subject to change without notice.
Revised: 01/20/14
Surface Mount – 500W > SACB series
Electrical Characteristics
(T
A
=25°C unless otherwise noted)
Part
Number
Marking
Code
Stand-Off
Voltage
(Note1) V
R
(V)
Minimum
Breakdown
Voltage at
I
T
=1.0MA
V
BR
(V)
Maximum
Reverse
Leakage
at V
R
I
R
A)
Maximum
Clamping
Voltage at
I
PP
=5.0A
V
C
(V)
Maximum
Peak
Pulse
Current
per (Fig.3)
I
PP
(A)
Maximum
Junction
Capacitance
at
0 Volts (pF)
Working
Inverse
Blocking
Voltage
V
WIB
(V)
Inverse
Blocking
Leakage
Current at
V
WIB
@ I
IB
(mA)
Peak Inverse
Blocking
Voltage V
PIB
(V)
UL
Recognition
SACB5.0
SKE
5.0
7.60
300
10.0
44.0
45
75
1.0
100
X
SACB6.0
SKG
6.0
7.90
300
11.2
41.0
45
75
1.0
100
X
SACB7.0
SKM
7.0
8.33
300
12.6
38.0
45
75
1.0
100
X
SACB8.0
SKR
8.0
8.89
100
13.4
36.0
45
75
1.0
100
X
SACB8.5
SKT
8.5
9.44
50
14.0
34.0
45
75
1.0
100
X
SACB10
SKX
10.0
11.10
5
16.3
29.0
45
75
1.0
100
X
SACB12
SLE
12.0
13.30
5
19.0
25.0
45
75
1.0
100
X
SACB15
SLM
15.0
16.70
5
23.6
20.0
45
75
1.0
100
X
SACB18
SLT
18.0
20.00
5
28.8
15.0
45
75
1.0
100
X
SACB22
SLX
22.0
24.40
5
35.4
14.0
45
75
1.0
100
X
SACB26
SME
26.0
28.90
5
42.3
11.1
45
75
1.0
100
X
SACB30
SMK
30.0
33.30
5
48.6
10.0
45
75
1.0
100
X
SACB36
SMP
36.0
40.00
5
60.0
8.6
45
75
1.0
100
X
SACB45
SMV
45.0
50.00
5
77.0
6.8
45
150
1.0
200
X
SACB50
SMZ
50.0
55.50
5
88.0
5.8
45
150
1.0
200
X
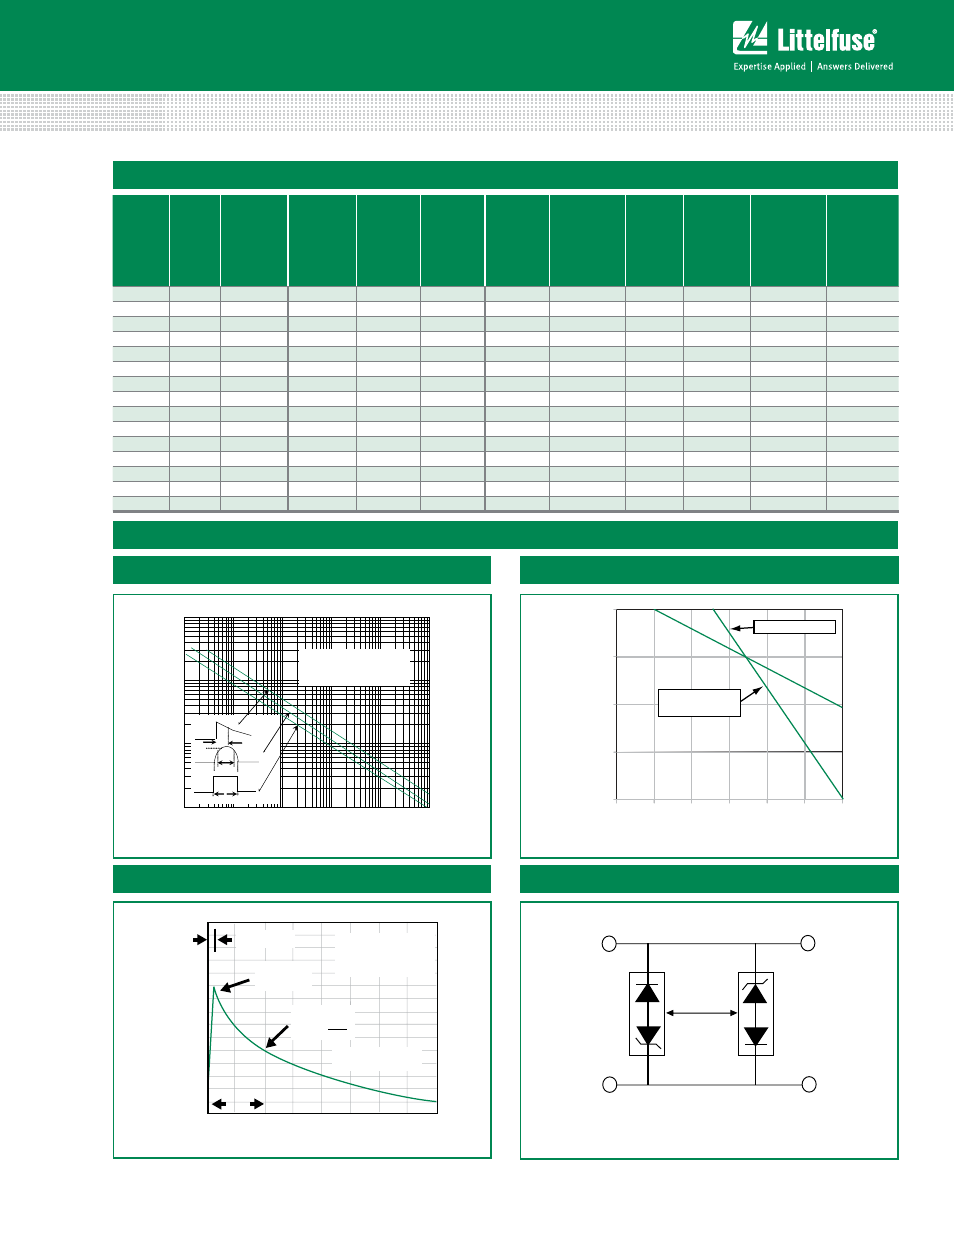
Ratings and Characteristic Curves
(T
A
=25°C unless otherwise noted
Low Capacitance
Application Note: Device must be used with two
units in parallel, opposite in polarity as shown in
circuit for AC signal line protection.
Figure 4 - AC Line Protection Application
0.1
1
10
100
0.1µs
1.0µs
10µs
100µs
1.0ms
10ms
I
PPM
- Peak
Pulse Power (kW)
t
d
- Pulse Width (sec.)
Non-repetitive Pulse
Waveform shown in Fig. 3
T
A
=25°C
30
Current Waveforms
Square
P
PK
td=7tp
td
td
P
PK
Half Sine
Impulse
td
P
PK
".5"
Exponential
Decay
SACB: Revised Figure 1 - Peak Pulse Power Rating Curve
Ratings and Characteristic Curves
(T
A
= 25°C unless otherwise noted)
I
PPM
- P
eak P
ulse Cur
rent, %
I
RSM
0
0
50
100
150
1.0
2.0
3.0
4.0
tr=10µsec
Peak Value
IPPM
IPPM
2
TJ=25°C
Pulse Width(td) is defined
as the point where the peak
current decays to 50% of IPPM
10/1000µsec. Waveform
as defined by R.E.A
td
t-Time (ms)
Half Value
IPPM
( )
0
25
50
75
100
0
25
50
75
100
125
150
Percentage of Rated Power (%)
Average Power
Peak Power
(Single Pulse)
T
L
- Lead Temperature (ºC)
Figure 1 - Peak Pulse Power Rating Curve
Figure 2 - Pulse Derating Curve
Figure 3 - Pulse Waveform