Th7899m – Rainbow Electronics TH7899M User Manual
Page 17
17
TH7899M
2201A–IMAGE–02/02
Notes:
1. Saturation level is the maximum charge level before vertical transfer efficiency degradation (out of specification).
2. Saturation level is the maximum charge level before horizontal transfer efficiency degradation (out of specification).
3. Saturation level on output node can be optimized by running the readout register in MPP mode. Nevertheless, such a
method implies that the capacitances of the
Φ
L clocks are roughly 30% higher.
4. Measured with the Correlated Double Sampling (CDS).
5. Dynamic range is defined by the ratio of the saturation level to the temporal rms noise in darkness.
6. With a horizontal frequency maximum of 20 MHz, this value will be improved when decreasing this frequency.
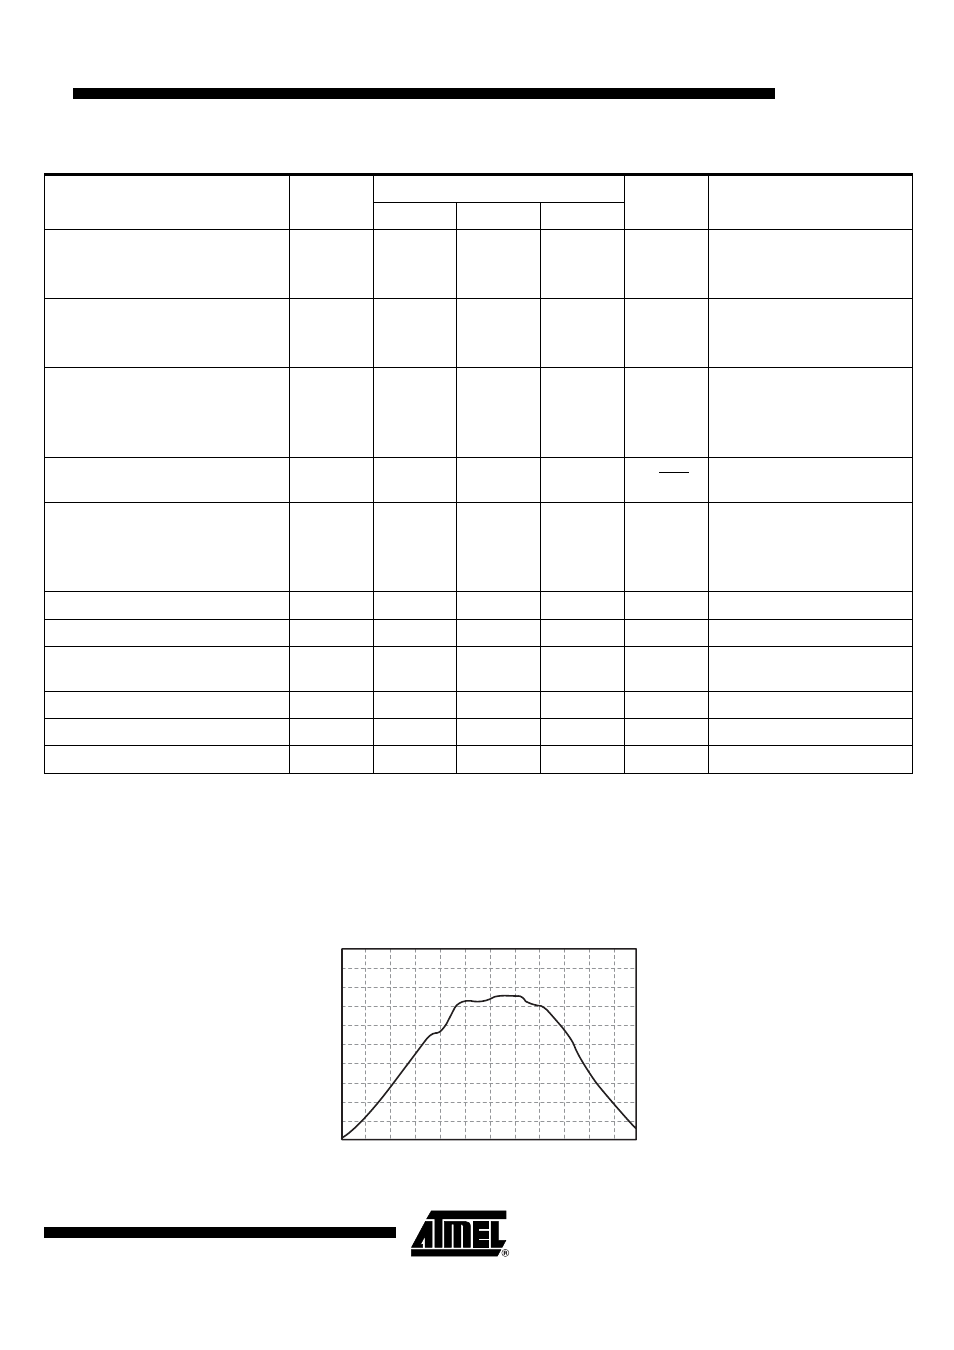
Figure 14. Typical Spectral Response
Rms Output Amplifier Noise
With a Bandwidth of 80MHz
With a Bandwidth < 5MHz
N1
N2
20
5
e-
e-
Output Frequency = 20 MHz
Output Frequency < 1 MHz
Dark Current
MPP Mode
Non MPP Mode
I01
I02
25
0.6
30
1
pA/cm
2
nA/cm
2
T = 25°C
T = 25°C
Dynamic Range
Exposure Time =10 ms
Readout Time = 2s, FV = 100 kHz
Readout Through One Output
SNR
9800
T = 25°C, Without Binning
Photo-response Non Uniformity,
σ
PRNU
1
2.5
% VOS
Dark Signal Non Uniformity,
σ
Exposure Time = 10 ms,
Readout Time = 2s, FV = 100 kHz
Readout Through One Output
DSNU
2.2
3
mV
T = 25°C
Horizontal Transfer Efficiency
1 -
ε
H
0.99993
0.99997
Vertical Transfer Efficiency
1 -
ε
V
0.99998
0.99999
Contrast Transfer Function at
Nyquist Frequency
CTF
67
%
Responsivity
R
8.5
V/µJ/cm
2
With BG38 Filter
Linearity Error
LE
< 1
%
Without Binning
Flatness (Peak To Peak)
13
20
µm
Table 4. Electro-optical Performance Characteristics (Continued)
Parameter
Symbol
Value
Unit
Remarks
Min
Typ
Max
0
10
20
30
40
50
400
500
600
700
800
900
1000
Wavelength (nm)
Quantum efficiency (%)