5 events peak spectrum, 6 events table, Events peak spectrum – Soft dB Opus Suite Building Vib Module User Manual
Page 18: Events table
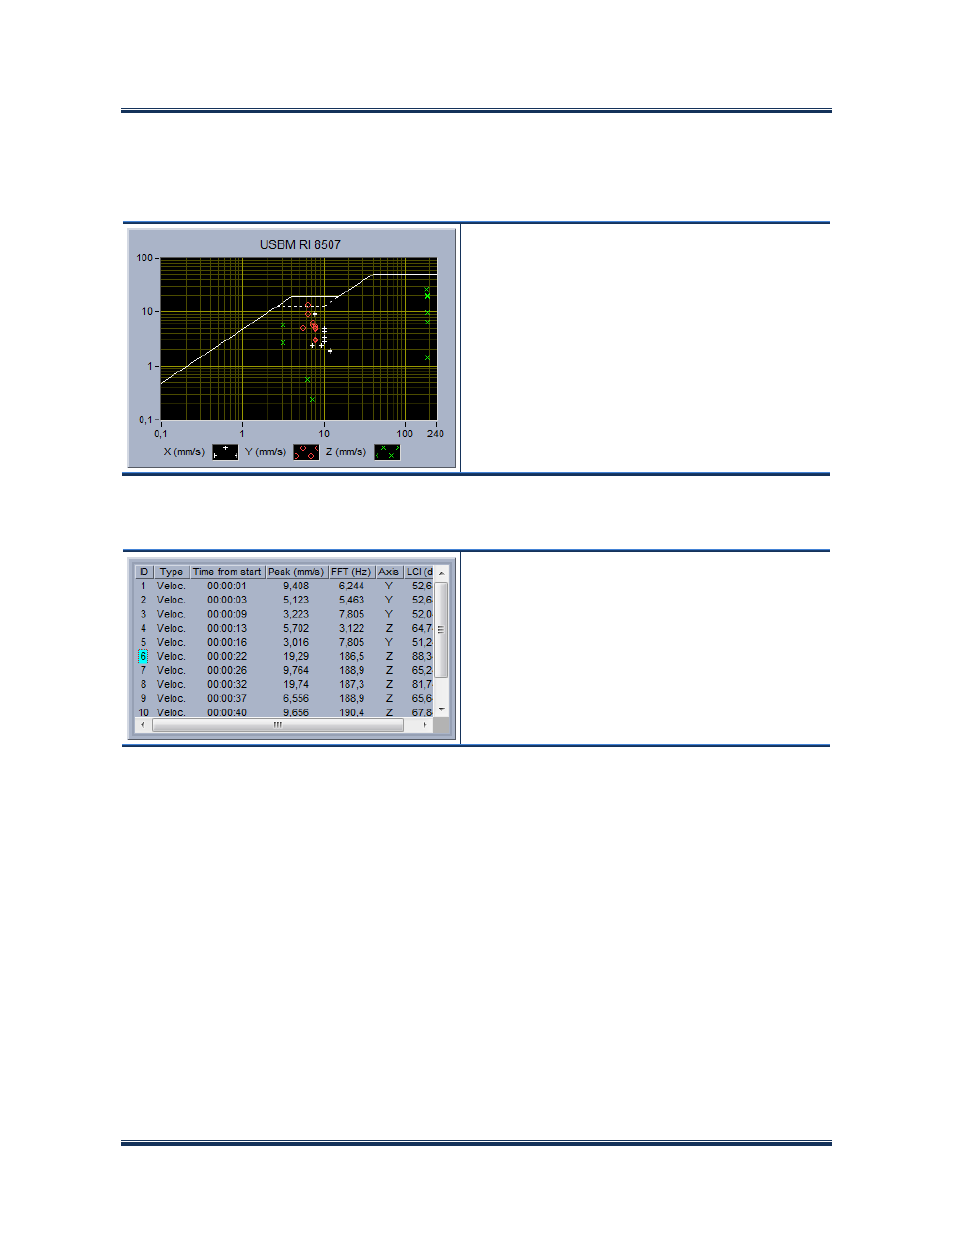
6.5 Events Peak Spectrum
This indicator displays each event X, Y and Z axis
peaks and associated frequency. The frequency can
be either FFT (DIN 4150) or Zero Crossing.
A reference curve can be displayed on this
spectrum. This reference curve can be DIN 4150 or
USBM RI 8507.
Use the Display Setup to change the settings of this
indicator.
6.6 Events Table
This indicator displays relevant information about
each event. The columns of this list box can be
selected from a variety of choice in the Display
Setup.
Click on the list to select an event to display on the
waveforms.
14