Viewing aerial photos of landmarks, Animated tide and current indicators, Detailed road and point of interest data – Garmin GPSMAP 5215 User Manual
Page 30: Auto guidance, Your surroundings
26
GPSMAP
®
4000/5000 Series Owner’s Manual
Charts and 3D Chart Views
Viewing Aerial Photos of Landmarks
Before you can view aerial photos on the Navigation Chart, you must turn on the Photo Points setting
Preprogrammed BlueChart g2 Vision data cards contain aerial photographs of many landmarks, marinas, and
harbors. Use these photos to help orient yourself to your surroundings or to acquaint yourself with a marina or
a harbor prior to arrival.
1. From the Home screen, select Charts > Navigation Chart.
2. Select a camera icon.
• A standard camera icon (
) indicates an overhead photo.
• A camera icon with a cone (
) indicates a perspective photo. The photo was taken from the
location of the camera, pointed in the direction of the cone.
3. Select Review > Aerial Photo.
Note: Press the Range (-/+) keys (GPSMAP 4000 series) or touch or (GPSMAP 5000 series), to
zoom out and in while viewing the aerial photo on the full screen.
Animated Tide and Current Indicators
You can view indicators for animated tide station and current direction on the Navigation Chart or the Fishing
Chart. To do so, tide station and current direction information must be available in your preloaded map or
BlueChart g2 Vision region. You must also select the Animated value for the Tides/Currents setting (
An indicator for a tide station appears on the chart as a vertical bar graph with an arrow. A red
arrow pointing downward indicates a falling tide, and a blue arrow pointing upward indicates a
rising tide. When you move the cursor over the tide station indicator, the height of the tide at the
station appears above the station indicator.
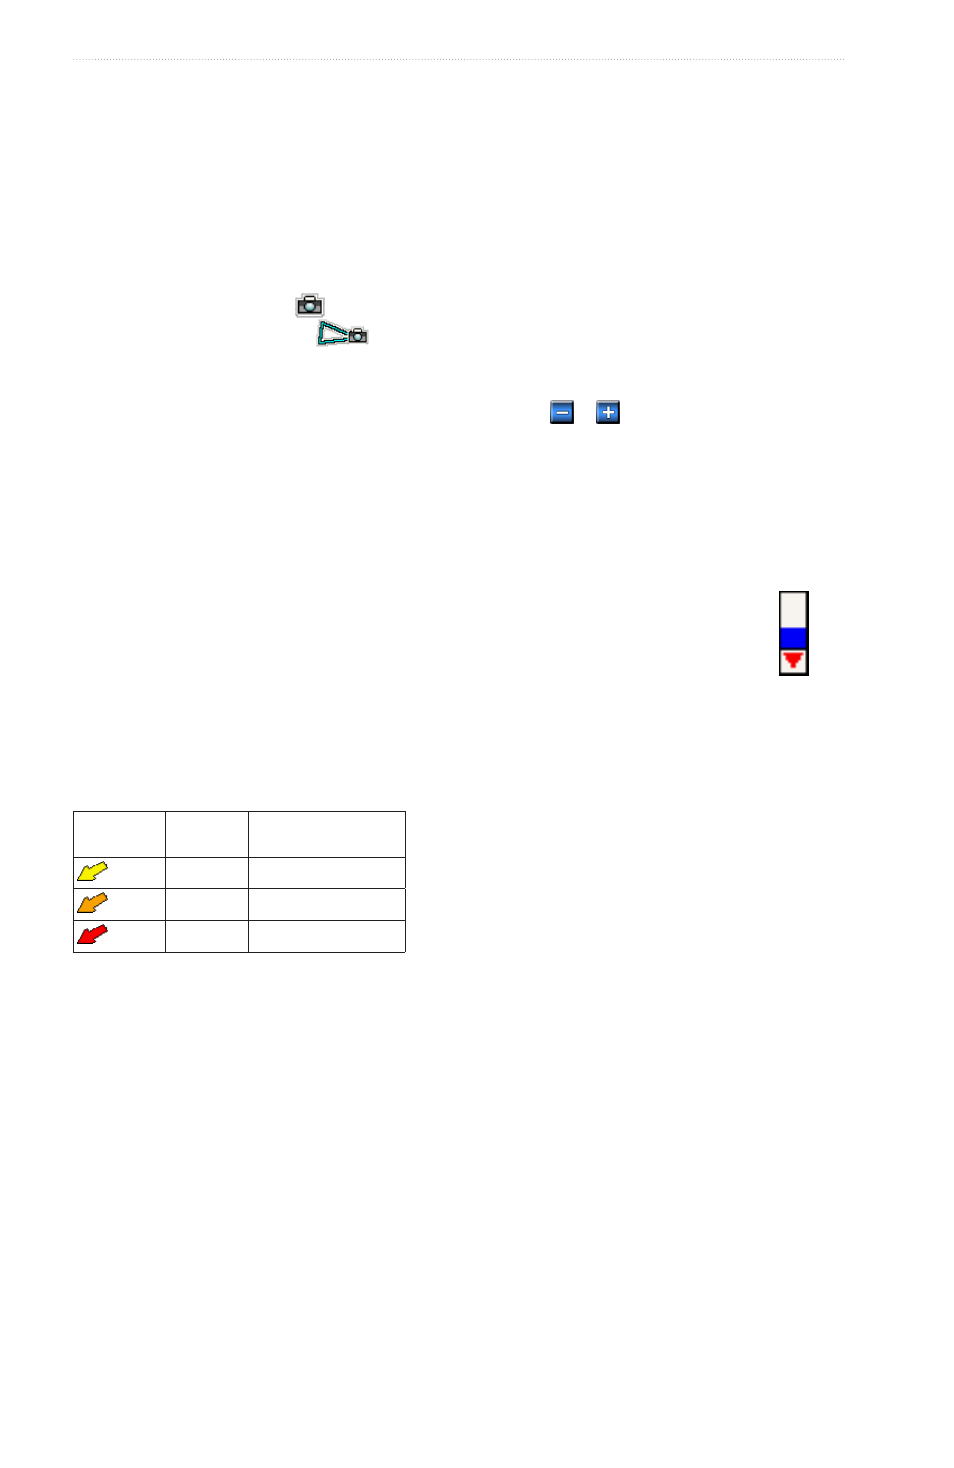
Current direction indicators appear as arrows on the chart. The direction of each arrow indicates
the direction of the current at a specific location on the chart. The color of the current arrow
indicates the range of speed of the current at that location. When you move the cursor over the
current direction indicator, the specific speed of the current at the location appears above the
direction indicator.
Direction
Indicator
Color
Current Speed
Range
Yellow
0 to 1 knot
Orange
1 to 2 knots
Red
2 or more knots
Viewing Current Station Information
See “Current Information” (
).
Detailed Road and Point of Interest Data
BlueChart g2 Vision contains detailed road and point of interest (POI) data, which includes highly detailed
coastal roads and points of interest (POIs) such as restaurants, lodging, local attractions, and more.
Searching for, and Navigating to, POIs
See “Where To?” (
Auto Guidance
Auto Guidance automatically creates and suggests the best path to a destination, based on available BlueChart
g2 Vision chart information. Auto Guidance is available when you navigate to a destination using Guide To
Configuring Auto Guidance Settings
See “Auto Guidance Line Configurations” (
page 53
).
Tide
Station
with Falling
Tide