Oxygen limit fraction (olf) – SUUNTO Gekko User Manual
Page 31
29
In Dive mode, the oxygen percentage labeled with
O
2
% and the current oxygen toxicity exposure shown
with an Oxygen Limit Fraction (OLF) bar graph are
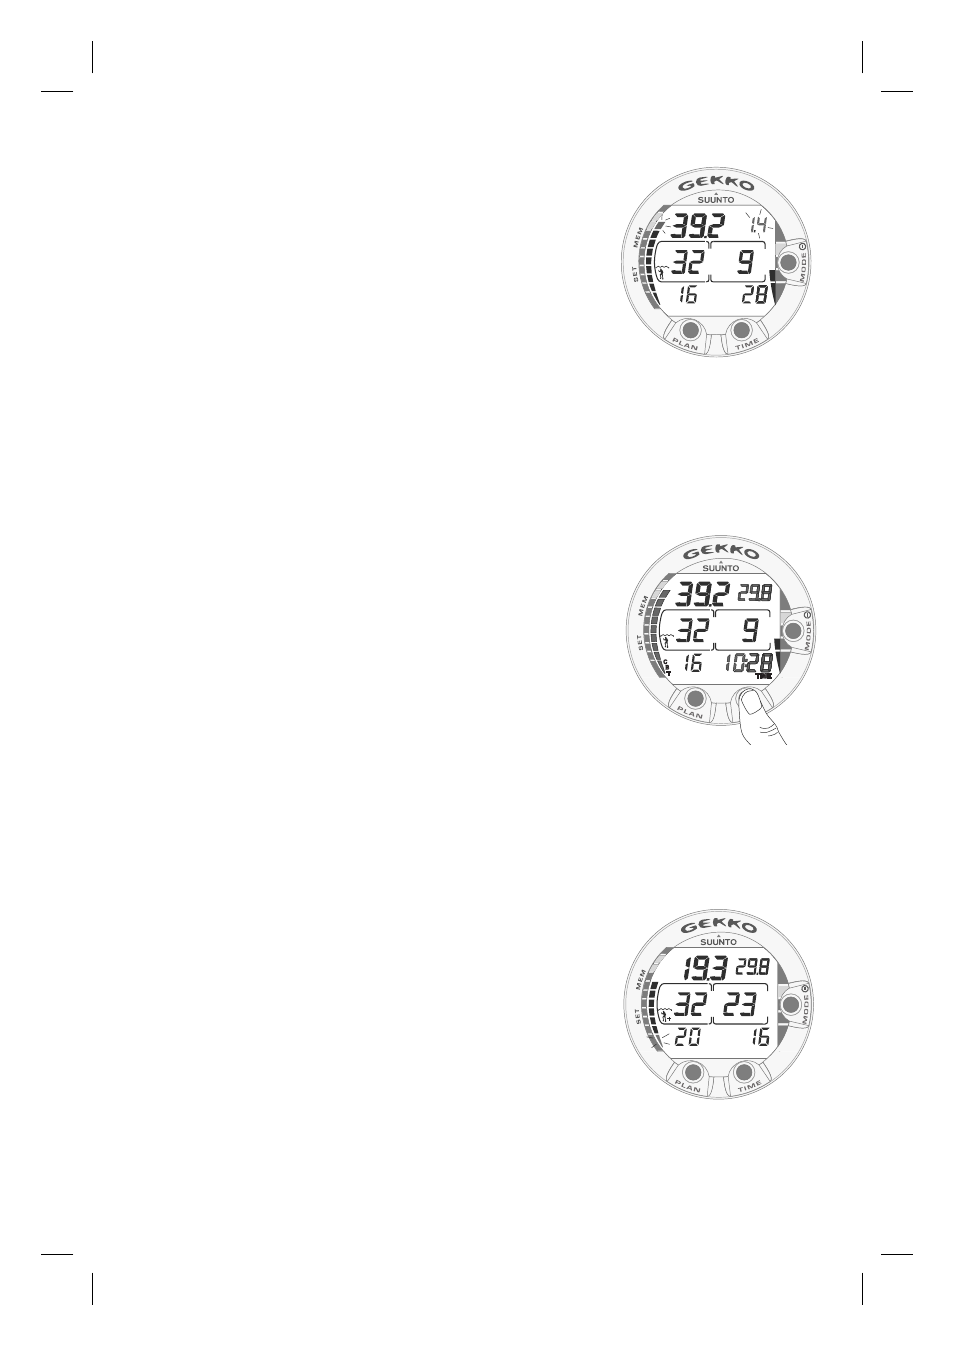
shown (Fig. 3.21. and Fig. 3.22.). During a dive, the
oxygen partial pressure, labeled with PO
2
, is also
shown instead of the maximum depth in the upper
right display, if the partial pressure is greater than
1.4 bar or the set value (Fig. 3.23.).
By pressing the TIME button during a nitrox dive,
the alternative display appears, which includes (Fig.
3.24.):
• current time
• Consumed Bottom Time
• maximum depth (during decompression stop
dive).
After fi ve seconds the display will automatically
revert to the original display.
3.4.3. Oxygen Limit Fraction
(OLF)
In addition to tracking the diver’s exposure to nitro-
gen, the instrument tracks the e xposure to oxygen,
if set to Nitrox mode. These calculations are treated
as entirely separate functions.
The dive computer calculates separately for Cen-
tral Nervous System oxygen toxicity (CNS) and
Pulmonary Oxygen toxicity, the latter measured by
the addition of Oxygen Toxicity Units (OTU). Both
fractions are scaled so that the maximum tolerated
exposure for each is expressed as 100%.
The Oxygen Limit Fraction (OLF) has 11 segments,
each representing 10%. The OLF bar graph displays
only the value of the higher of the two calculations.
When the OTU value meets and exceeds the CNS
value then in addition to displaying its percentage
the lowest segment blinks to indicate that the value
shown relates to OTU (Fig. 3.25.). The oxygen tox-
icity calculations are based on the f actors listed in
section 6.3. “Oxygen Exposure”.
Fig. 3.23. Oxygen partial
pressure and OLF displays.
There is an audible alarm
as oxygen partial pressure
is greater than 1.4 bar or set
value, and/or the OLF has
reached 80% limit.
°
C
TIME
DIVE
O2%
m
NO DEC TIME
OLF
PO2
BEEP
BEEP
BEEP
...
Fig. 3.24. Alternative
display. Pressing TIME
button displays current time,
maximum depth, tempera-
ture, CBT and O2%,
°
C
TIME
O2%
m
NO DEC TIME
TIME
MAX
T
C
B
Fig. 3.25. The lowest bar
graph blinks to indicate that
the OLF value shown relates
to OTU.
m
NO DEC TIME
°
C
MAX
DIVE TIME
O2%
OLF