Consumed bottom time (cbt), Ascent rate indicator – SUUNTO Gekko User Manual
Page 24
22
3.3.3. Consumed Bottom Time (CBT)
The available no-decompression stop time is also shown visually in the multi-
function bar graph on the left side of the display (Fig. 3.7. and 3.8.). When your
available no-decompression time decreases below 200 minutes, the fi rst (lowest)
bar graph segment appears. As your body absorbs more nitrogen, more segments
start to appear.
Green Zone - As a safety precaution Suunto recommends you should maintain
the no-decompression bar graph within the green zone. Segments start to appear
when the available no-decompression time decreases below 100, 80, 60, 50, 40,
30 and 20 minutes.
Yellow Zone- As the bars reach the yellow zone, your no-decompression stop time
is less than 10 or 5 minutes and you are getting very close to no-decompression
limits. At this point, you should start your ascent towards the surface.
Red Zone - As all of the bars appear (red zone), your no-decompression stop time
has become zero and your dive has become a decompression stop dive (for more
information see section 3.3.5. “Decompression dives”).
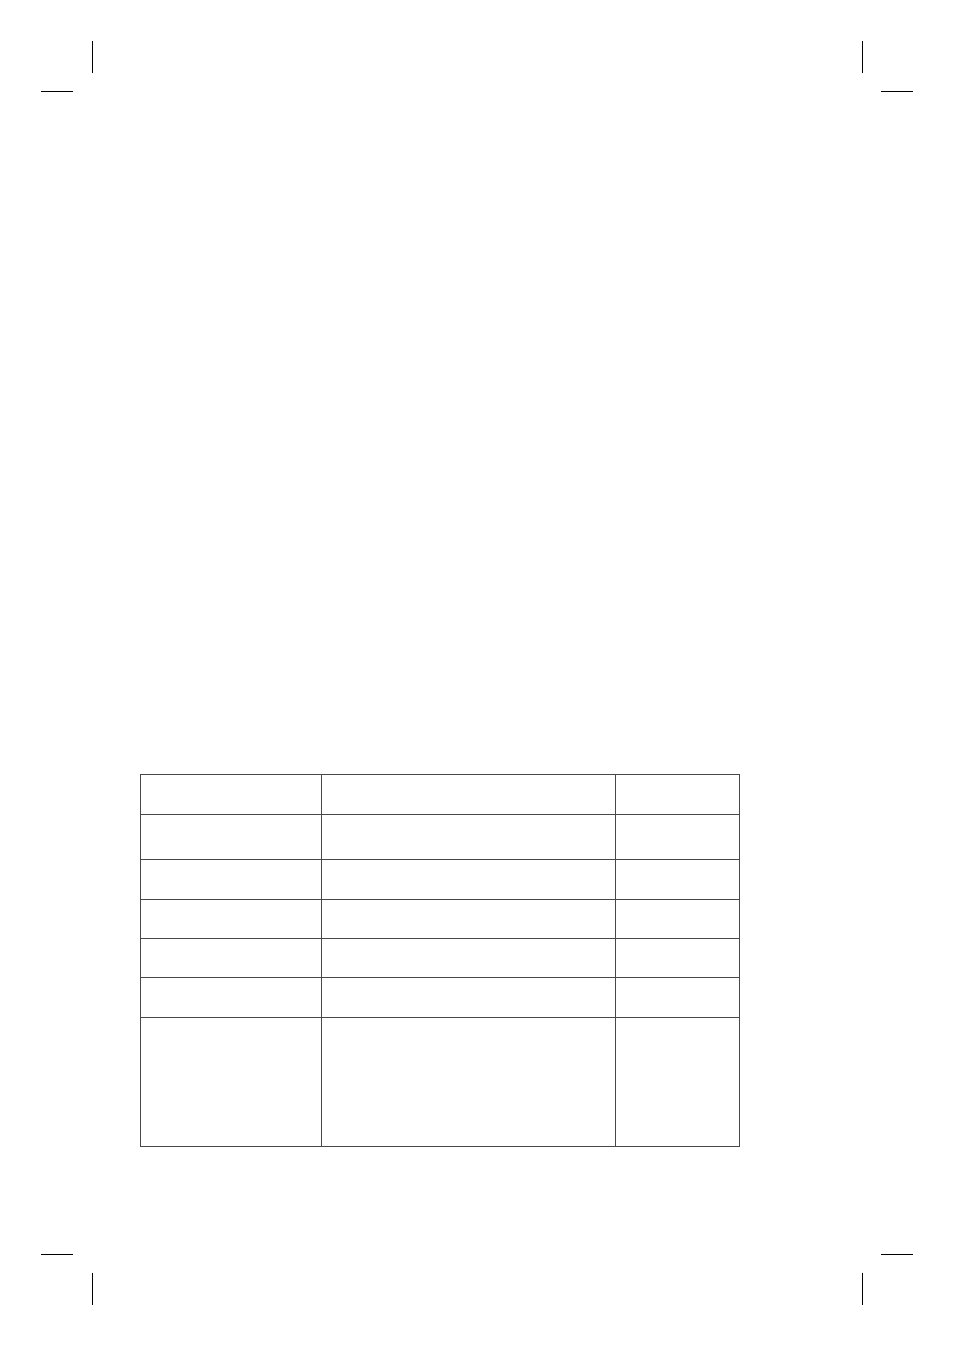
3.3.4. Ascent Rate Indicator
The ascent rate is sho wn graphically along the right side of the display as fol-
lows:
Ascent Rate Indicator
The equivalent ascent speed
Example in Fig.
No segments
Below 4 m/min [13 ft/min]
3.7
One segment
4 - 6 m/min [13 - 20 ft/min]
3.8
Two segments
6 - 8 m/min [20 - 26 ft/min]
3.9
Three segments
8 - 10 m/min [26 - 33 ft/min]
3.10
Four segments
10 - 12 m/min [33 - 39 ft/min]
3.11
Four segments,
Above 12 m/min [39 ft/min] or
3.12
the SLOW segment,
continuously above 10 m/min
blinking depth
[33 ft/min]
reading, the STOP
sign and an
audible alarm
TABLE 3.2. ASCENT RATE INDICATOR