1 system condition display – FUJITSU Service View Resource Orchestrator Cloud Edition V3.0.0 User Manual
Page 21
Item
Explanation
-
For the L-Server CI type: The L-Server name set during L-Platform subscription
or L-Platform reconfiguration ("server name (host name)")
Record
Displays the type of records held by the configuration item.
[0], indicating the actual information, is displayed.
Note
Clicking the CI list column headers to sort the columns is effective only for the range displayed in that page. The sorting specification is
reset when the next or previous page is displayed. Sorting spanning multiple pages is not available.
3.2.1 System Condition Display
The system condition of the L-Platforms selected in the system condition window CI list is displayed as a graph at System Condition in
the lower part of the window. Up to five L-Servers can be displayed at once in the graphs. If more than five L-Servers are selected, the
first five are displayed.
The system condition contents can be switched by clicking the System Condition tabs.
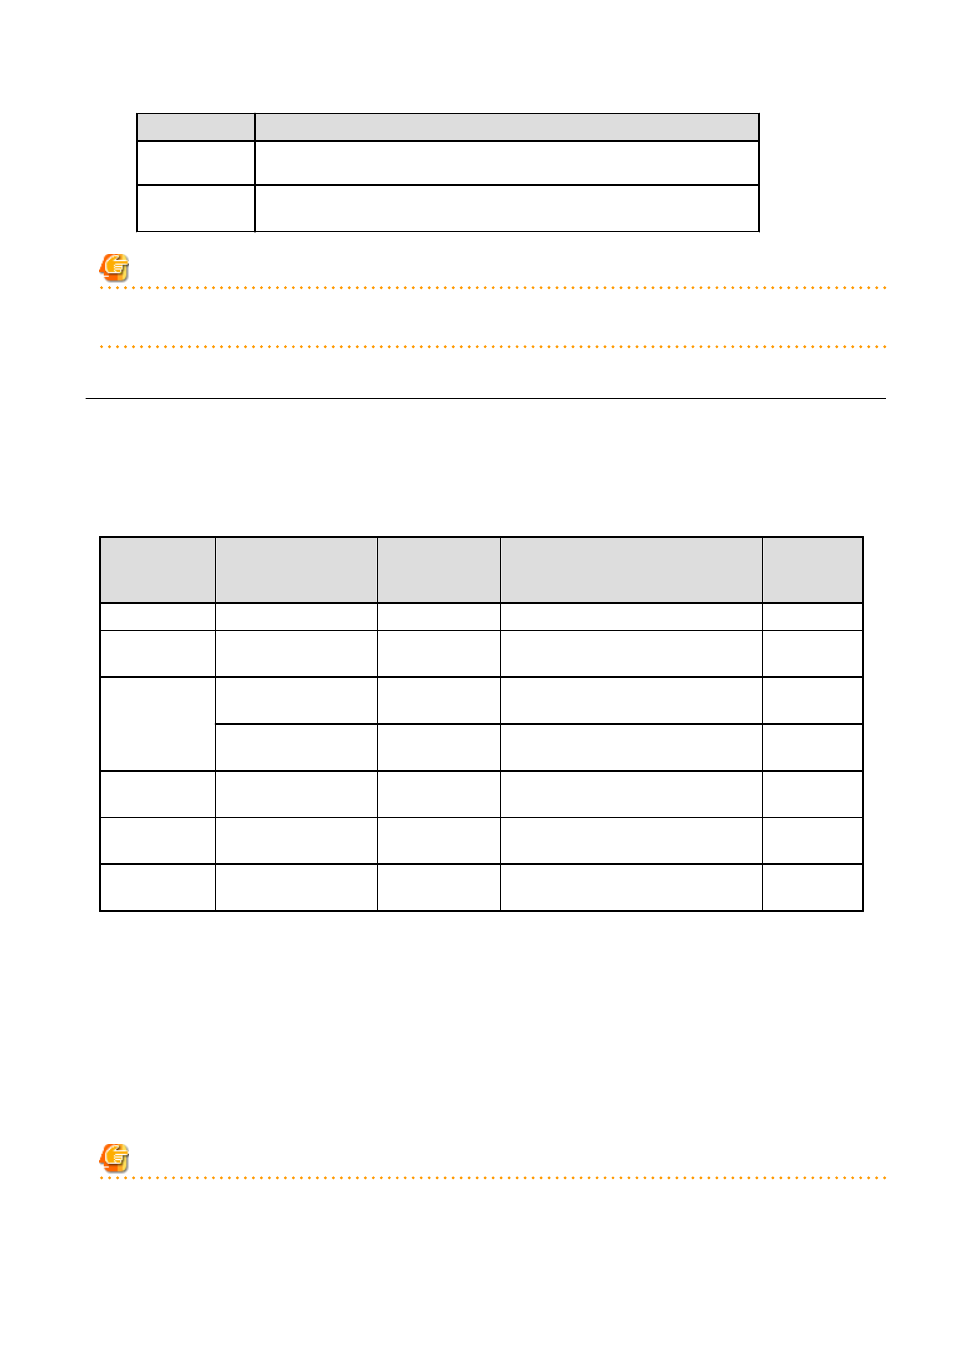
The table below shows the contents under the System Condition tabs.
Tab name
Display content (*1)
Graph type
Display interval
Display
interval
switching (*2)
Total
Totals for each status
Vertical bar graph
30 minutes, starting from the current time
Not possible
CPU
CPU utilization
Horizontal
polyline graph
One hour/day/month/year from the current
time
Possible
Disk
Disk R/W Usage (*3)
Horizontal
polyline graph
One hour/day/month/year from the current
time
Possible
Disk R/W count (*4)
Horizontal
polyline graph
One hour/day/month/year from the current
time
Possible
Memory
Memory usage (*5)
Horizontal
polyline graph
One hour/day/month/year from the current
time
Possible
Network
Network usage (*6)
Horizontal
polyline graph
One hour/day/month/year from the current
time
Possible
All
Overview of all the above
statuses
Horizontal
polyline graph
One hour/day/month/year from the current
time
Possible
*1: Information is displayed using a different color for each L-Server.
*2: The display interval can be switched to a shorter interval by clicking the data plotting area of a horizontal polyline graph, or switched
to a longer interval by clicking outside the data plotting area.
*3: Disk usage and network usage are not displayed if the virtualization software is Hyper-V and RHEL5-Xen.
*4: The disk R/W count is not displayed if the virtualization software is Hyper-V and RHEL-KVM.
*5: The memory usage is not displayed if the virtualization software is Hyper-V. However, it is displayed if the dynamic memory
setting is enabled.
*6: The network usage is not displayed if the virtualization software is Hyper-V and the physical L-Server is Linux.
Note
-
Information obtained from virtualization software is displayed in the system condition. Virtual Memory usage is not included.
- 14 -