Opening the fft analysis window, View controls, Horizontal controls (frequency axis) – MOTU Track16 - Desktop Studio FireWire/USB 2.0 Interface User Manual
Page 84
C U E M I X F X
84
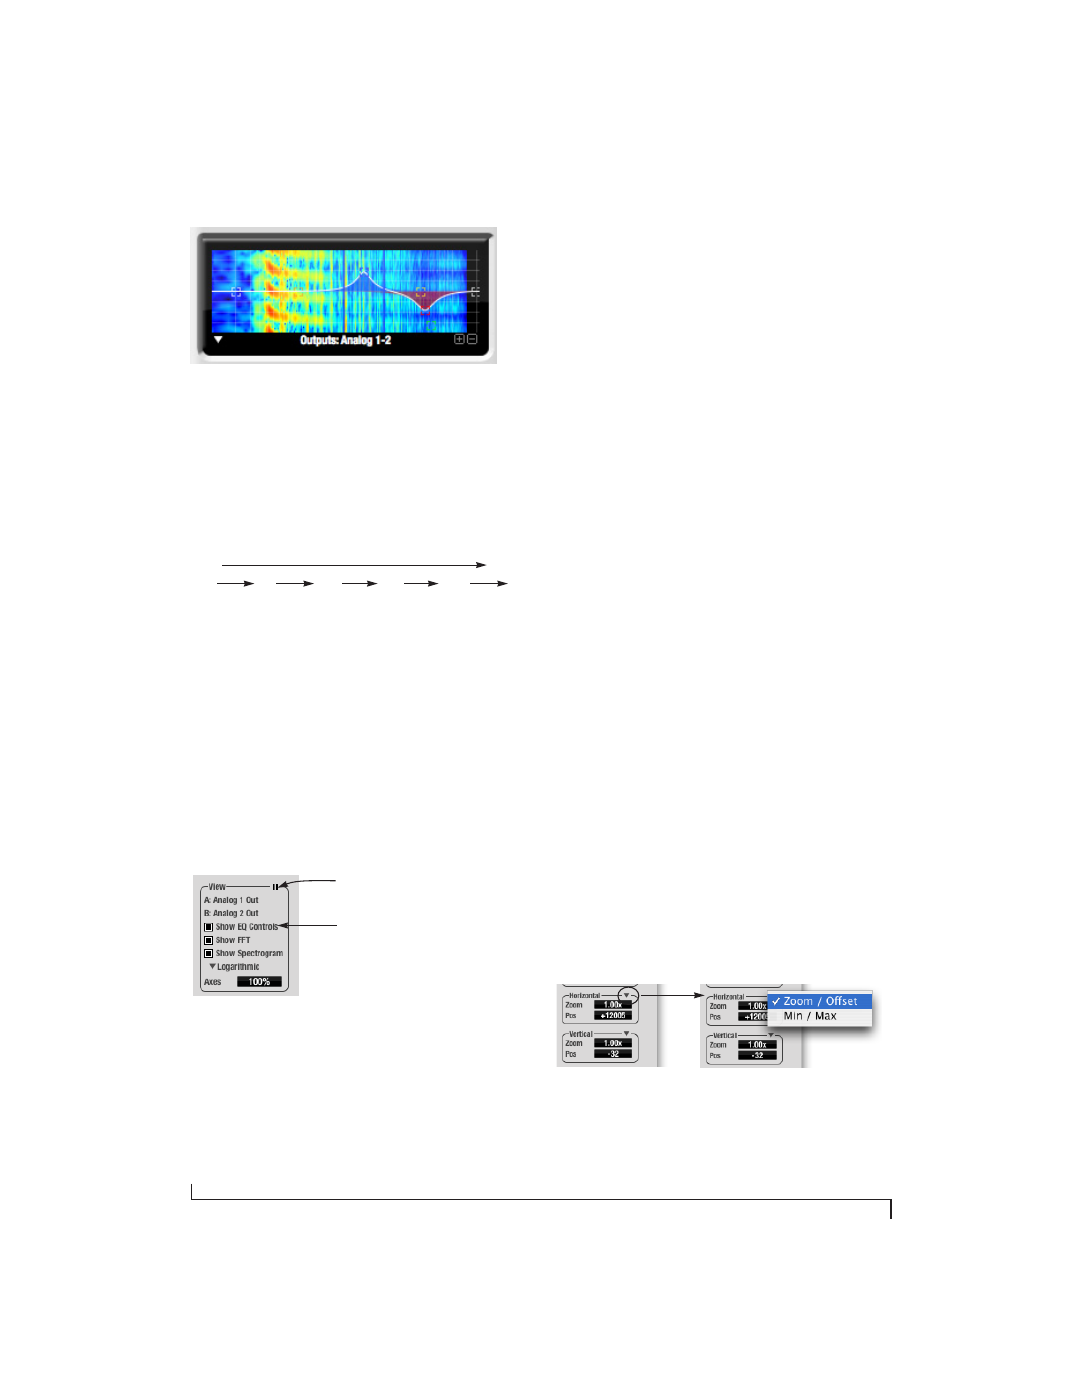
Figure 9-30: FFT display.
The spectrogram scrolls from top to bottom, where
the top edge of the display represents what you are
hearing “now”. Color represents amplitude along
the left/right frequency spectrum. The amplitude
color scale runs from black (silence) to red (full
scale) as follows:
Figure 9-31: Spectrogram color-to-amplitude spectrum.
Opening the FFT Analysis window
Choose
FFT Analysis
from the Devices menu
(Figure 9-26) to open a new window with the filter
EQ display for detailed inspection and adjustment
of the EQ filter, as shown Figure 9-28.
View controls
You can show and hide the FFT display,
spectrogram or EQ band response curves as
desired using the
View
controls
(Figure 9-32).
Figure 9-32: View controls
These settings are independent of the small graph
display options (Figure 9-10 on page 68), so you
have the flexibility to display different
combinations in each graph.
☛
“Show EQ Controls” will be available only if
the focused pair are a stereo input pair or stereo
output pair.
Logarithmic or Linear X-Axis Scale
The x-axis defaults to a logarithmic scale, but can
be changed to a linear scale if desired. In the View
controls (Figure 9-32), click
Logarithmic
to access
the x-axis scale options menu. With a linear scale
selected, frequency is constant, but the width of
each octave along the x-axis is different. With a
logarithmic scale selected, octaves are displayed
with a constant width, but frequency is displayed
logarithmically within each octave.
Axes display
The
Axes
control (Figure 9-32) sets the opacity of
the grid displayed in the graph, from 100% (fully
visible) down to 0% (fully hidden).
Pausing the display
The Pause button in the upper right corner of the
View section (Figure 9-32) allows you to freeze the
display at any time. To resume, click the button
again.
Horizontal controls (frequency axis)
The
Horizontal
controls (Figure 9-33) configure
the value range of the x-axis (frequency). Click and
drag the values up or down to set them, or double-
click to return to the default value.
There are two modes for the controls:
Zoom/Offset
and
Min/Max
. To change the mode, use the
Horizontal control menu (Figure 9-33).
Figure 9-33: Horizontal control menu
Black
Blue
Green
Yellow
Orange
Red
Silence
Full scale
Pause button
Display options