Example: plotting a circle – HP 39g+ User Manual
Page 60
2-20
Aplets and their views
Example: plotting a circle
Plot the circle, x
2
+ y
2
= 9. First rearrange it to read
.
To plot both the positive and negative y values, you need to
define two equations as follows:
and
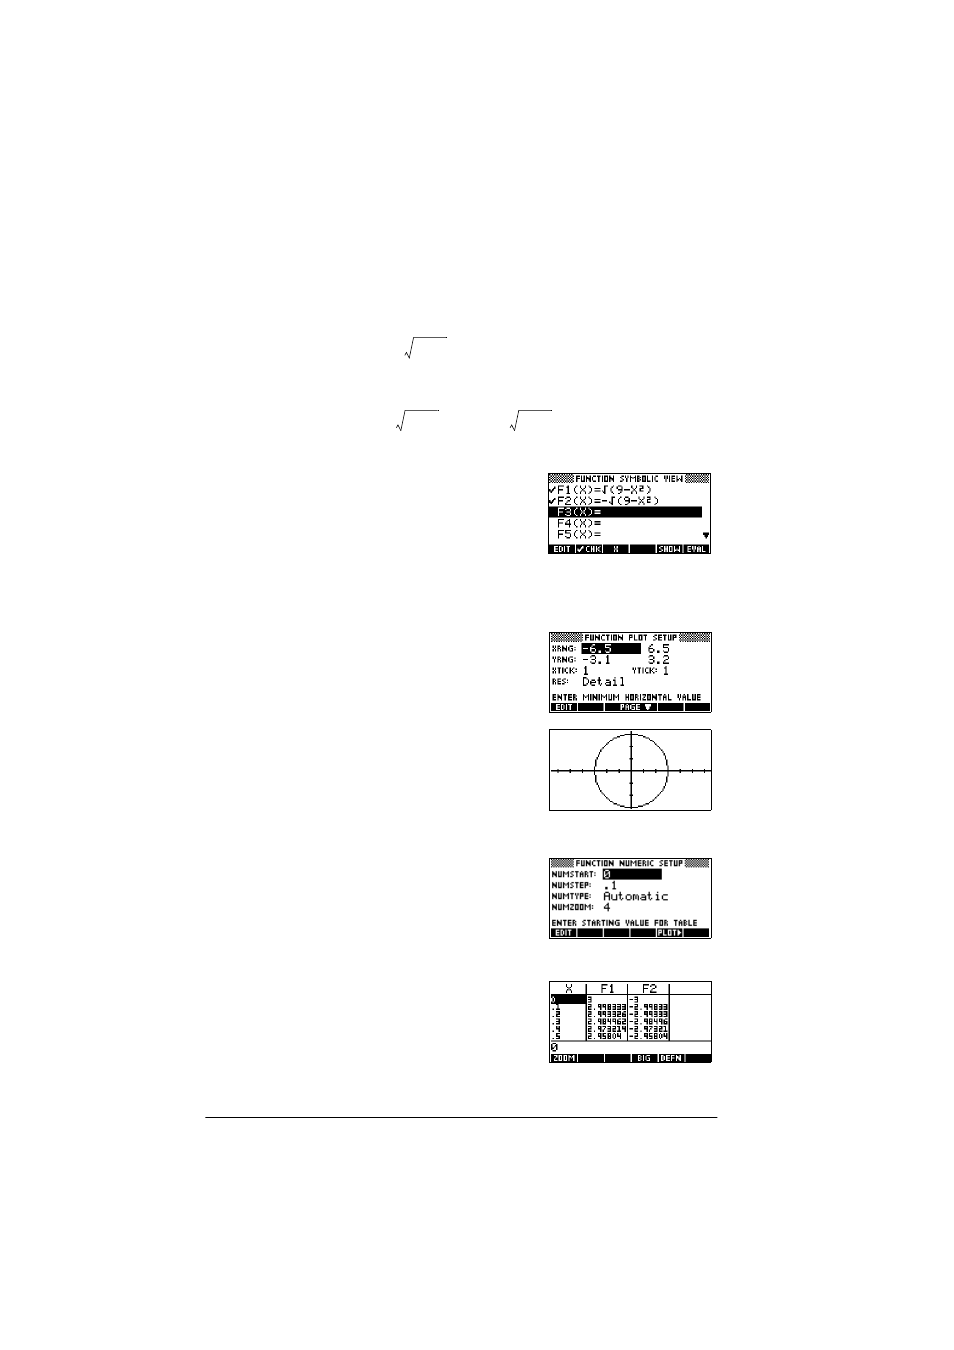
1. In the Function aplet, specify the functions.
>$3/(7@ Select
Function
TU6SU
>6+,)7@
√
>@ 9
>@>;75@>;@>@>(17(5@
>@ >6+,)7@
√
>@ 9
>@>;75@
>;@>@>(17(5@
2. Reset the graph setup to the default settings.
>6+,)7@
SETUP
-
PLOT
>6+,)7@
CLEAR
3. Plot the two functions
and hide the menu so that
you can see all the circle.
>3/27@
H@IVÃH@IV
4. Reset the numeric setup to the default settings.
>6+,)7@
SETUP
-
NUM
>6+,)7@
CLEAR
5. Display the functions in numeric form.
>180@
y
9
x
2
–
±
=
y
9
x
2
–
=
y
9
x
2
–
–
=
This manual is related to the following products: