Epson 660 User Manual
Page 54
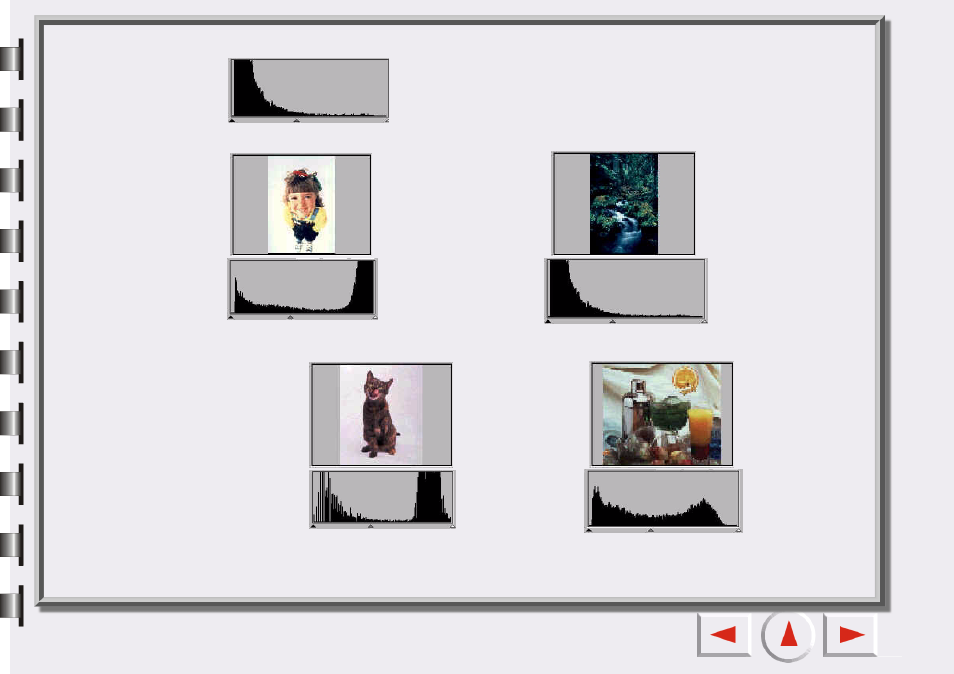
In addition, if we take a look at the two images below:
A Histogram displays the distributing status of dark and bright pixels in
an image. The x-axis is divided into 256 equal portions, representing the
brightness level of 0 to 255. The y-axis is used to represent the quantity
of pixel in each brightness level. A comparison of two images and their
histograms follows:
Brighter images have
brighter pixels, therefore
the bars in the right are
higher than that in the
left.
Darker images have
darker pixels, there-
fore the bars in left are
higher than that in the
right.
Image 1
Image 2
See also other documents in the category Epson Hardware:
- C8230 (29 pages)
- 400 (38 pages)
- 400 (148 pages)
- 600 (135 pages)
- 640 (45 pages)
- 700 (10 pages)
- 850 (147 pages)
- 1520 (40 pages)
- C82314 (71 pages)
- RS-485 (2 pages)
- 6200A (97 pages)
- C82307 (37 pages)
- UB E02 (86 pages)
- 440 (240 pages)
- 440 (212 pages)
- 5000 (176 pages)
- 5000 (154 pages)
- 9000 (68 pages)
- ARM.POWERED ARM720T (224 pages)
- SD-DSPUSBB (2 pages)
- CMD-2260 (18 pages)
- C823301 (17 pages)
- S1C6200A (98 pages)
- 33+ (10 pages)
- FEH300b (46 pages)
- SED 1520 Series (40 pages)
- Serial Interface GQ-3500 (13 pages)
- ETX-945 (39 pages)
- Photo EX (35 pages)
- C82364 (279 pages)
- 214D-1 (57 pages)
- EM07ZS1647F (168 pages)
- Connect-It SD-DSWIFIB (2 pages)
- ACTIONPC 7000 (10 pages)
- S5U1C63000H2 (35 pages)
- C824 (4 pages)
- C82069* (46 pages)
- 80211b (68 pages)
- C82312 (13 pages)
- S5U1C17801T1100 (60 pages)
- C82324* (57 pages)
- C82372 (22 pages)
- C82315 (48 pages)
- P07303 (36 pages)