Epson 660 User Manual
Page 51
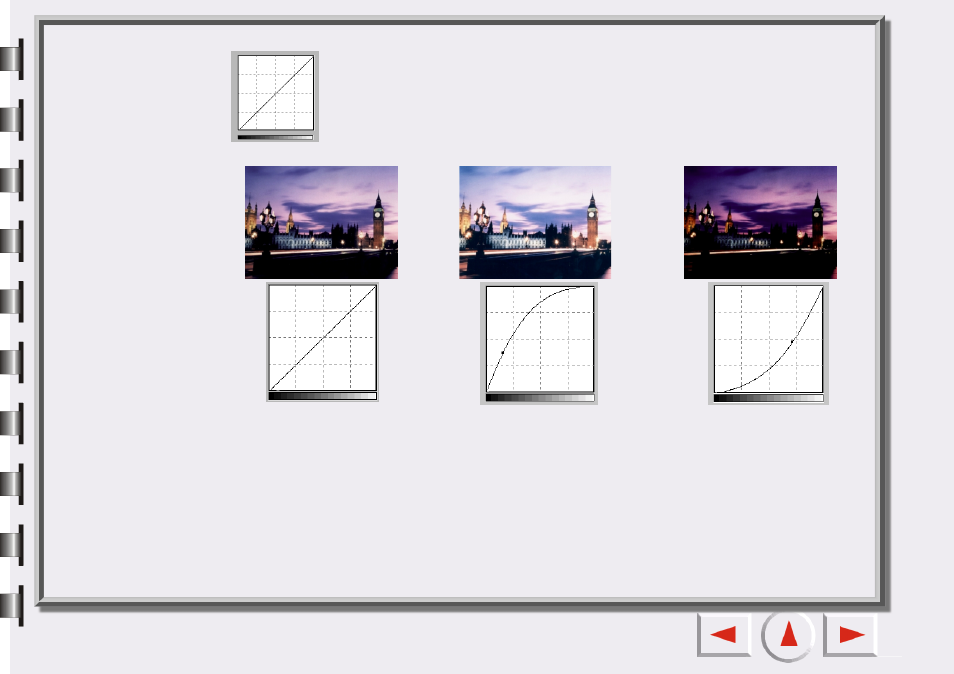
The x-axis in the Tonal Map represents the input brightness level of the pixels in an
image. The y-axis represents the output brightness level of the image. By clicking and
dragging the curve to change its shape, you can adjust the difference between input and
output brightness level of an image without extensively modifying the dark and bright
areas. If we compare the following images and their Tonal Maps:
The original image and its Tonal
Map.
The curve is straight and diago-
Drag the curve to the left, and
the mid-tone area of the image
becomes brighter.
Drag the curve to the right, and
the mid-tone area of the image
becomes darker.
See also other documents in the category Epson Hardware:
- C8230 (29 pages)
- 400 (38 pages)
- 400 (148 pages)
- 600 (135 pages)
- 640 (45 pages)
- 700 (10 pages)
- 850 (147 pages)
- 1520 (40 pages)
- C82314 (71 pages)
- RS-485 (2 pages)
- 6200A (97 pages)
- C82307 (37 pages)
- UB E02 (86 pages)
- 440 (240 pages)
- 440 (212 pages)
- 5000 (176 pages)
- 5000 (154 pages)
- 9000 (68 pages)
- ARM.POWERED ARM720T (224 pages)
- SD-DSPUSBB (2 pages)
- CMD-2260 (18 pages)
- C823301 (17 pages)
- S1C6200A (98 pages)
- 33+ (10 pages)
- FEH300b (46 pages)
- SED 1520 Series (40 pages)
- Serial Interface GQ-3500 (13 pages)
- ETX-945 (39 pages)
- Photo EX (35 pages)
- C82364 (279 pages)
- 214D-1 (57 pages)
- EM07ZS1647F (168 pages)
- Connect-It SD-DSWIFIB (2 pages)
- ACTIONPC 7000 (10 pages)
- S5U1C63000H2 (35 pages)
- C824 (4 pages)
- C82069* (46 pages)
- 80211b (68 pages)
- C82312 (13 pages)
- S5U1C17801T1100 (60 pages)
- C82324* (57 pages)
- C82372 (22 pages)
- C82315 (48 pages)
- P07303 (36 pages)