3 the filter design window – Guralp Systems Scream User Manual
Page 40
Scream! 4.5
window, hold
at the same time. To zoom out, right-click on the
frequency scale, holding
, if necessary, to apply to all
spectrograms.
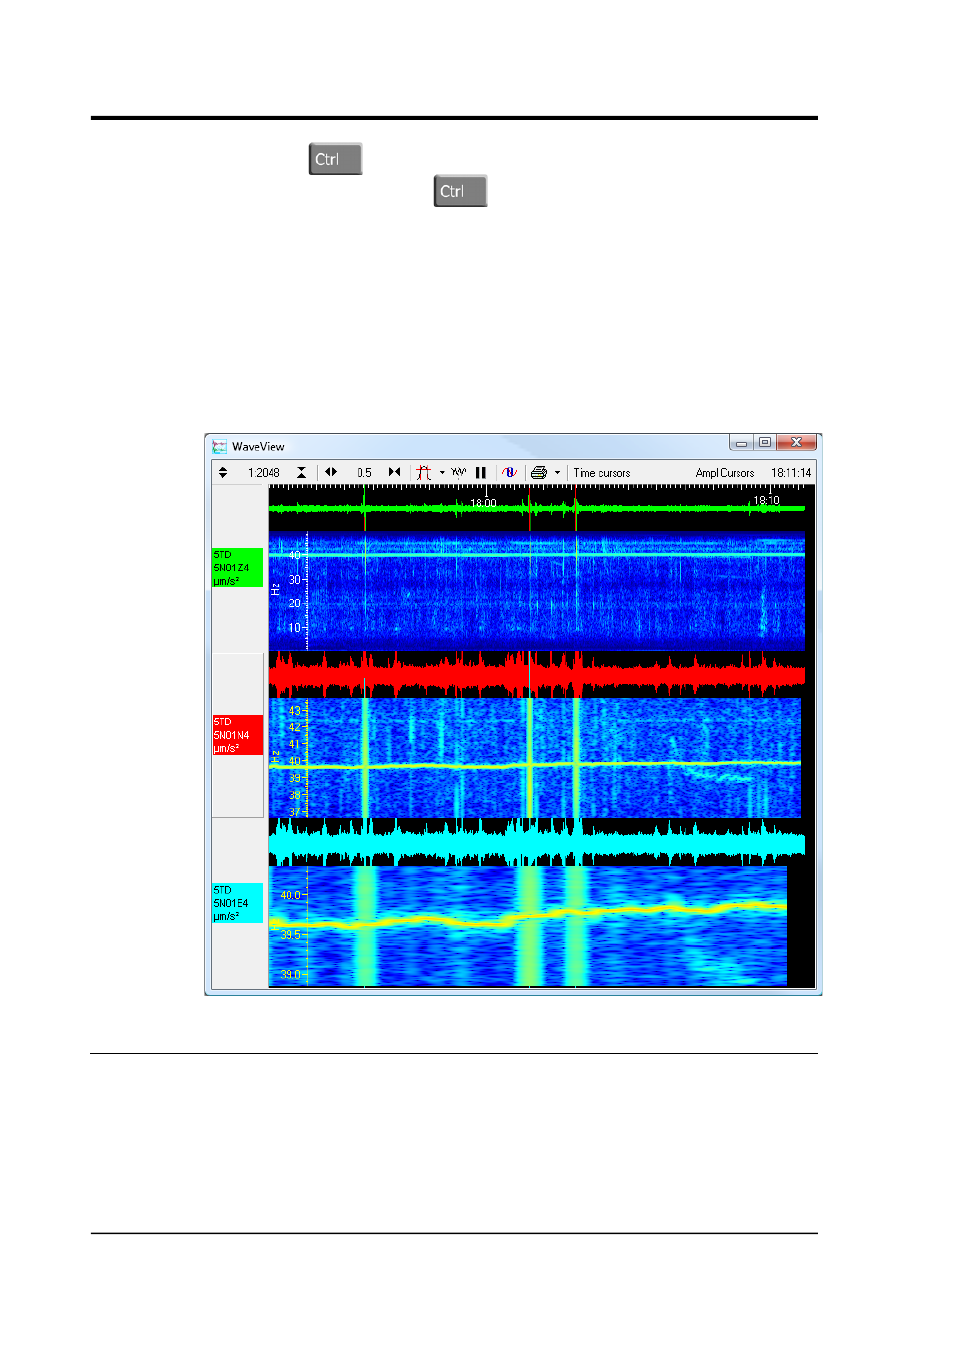
The example below shows data from a CMG-5TD which is sensing a
signal of approximately 40 Hz (green trace at the top). The Red trace
shows the N/S component, with the spectrogram zoomed in once, and
the blue trace where the spectrogram is zoomed in again, to the
39-40.5 Hz region. On closer inspection, it can be seen that the signal
frequency is changing over time, which was not apparent from the
un-zoomed green trace.
4.3 The Filter Design window
The Filter Design window allows you to alter the appearance of
streams in Waveview windows by applying low-pass, high-pass or
band-pass filters. Each Waveview window can have its own Filter
Design settings.
40
Issue K