Guralp Systems Scream User Manual
Page 39
User guide
compare streams by placing one directly on top of another. The lane
used for selecting the streams stays the same.
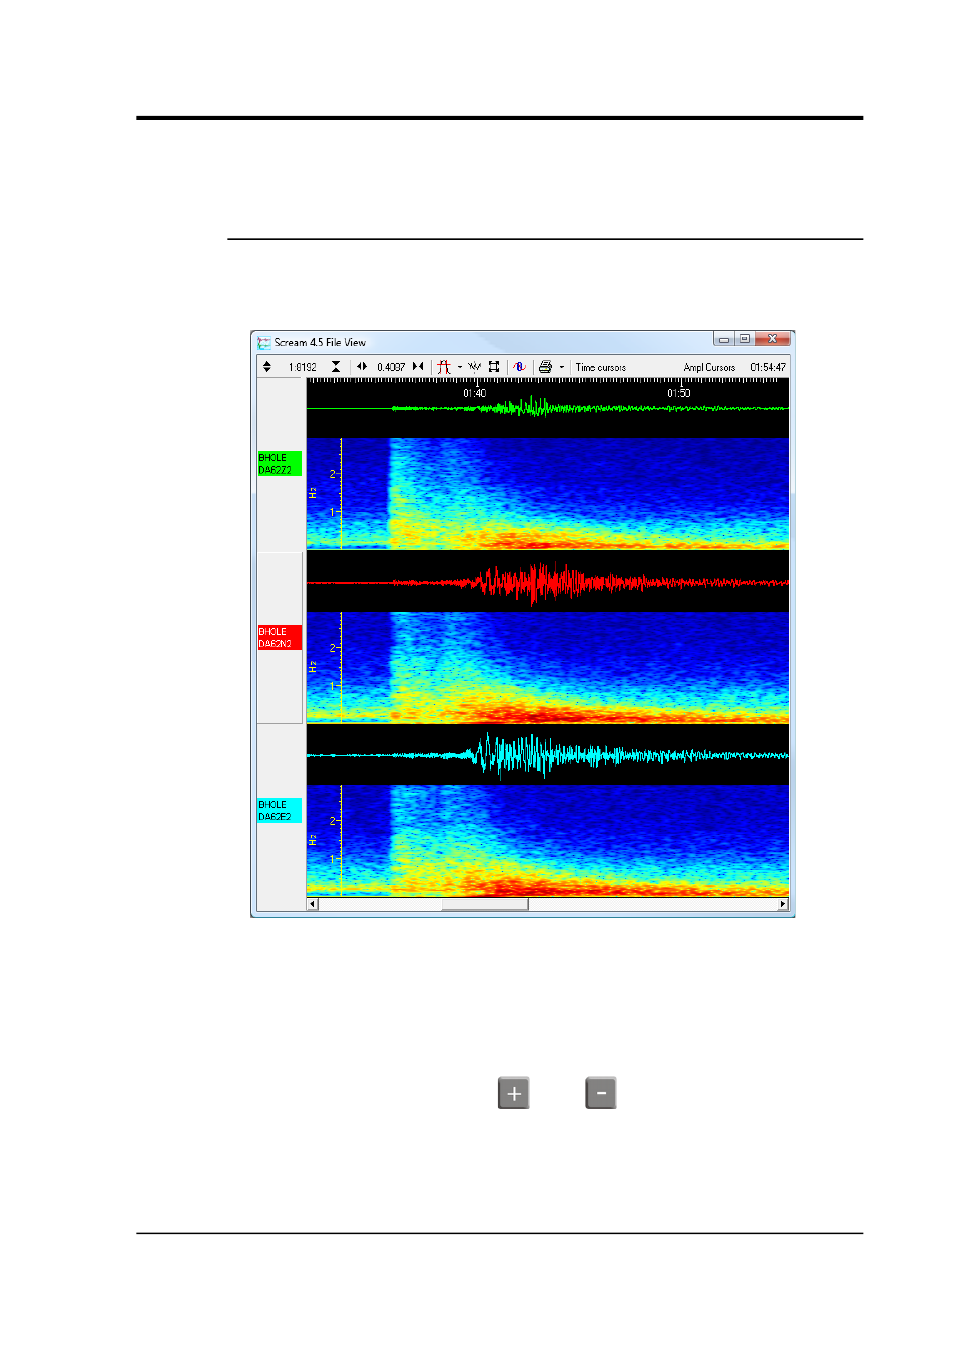
4.2.5 Spectrogram
Scream! can perform real-time spectral analysis on incoming data. To
enable this feature, right-click on the stream of interest in the
Waveview window and choose Spectrogram from the pop-up menu.
The vertical axis of the spectrum is linear, with the Nyquist frequency
(= half the sample rate) at the top and 0 Hz (DC) at the bottom. The
colouring is logarithmic, giving a large total range whilst retaining
sensitivity at low signal levels.
The width of the spectrum can be changed in the Display options pane
of the Setup window. The
and
keys adjusts the colour
contrast of the spectrogram.
The spectrogram supports zooming in by dragging a selection on the
frequency scale. To apply the zoom to all spectrograms in the
January 2014
39