Drive charts – Daktronics DakStats Football GameCast User Manual
Page 19
In Game Operations
15
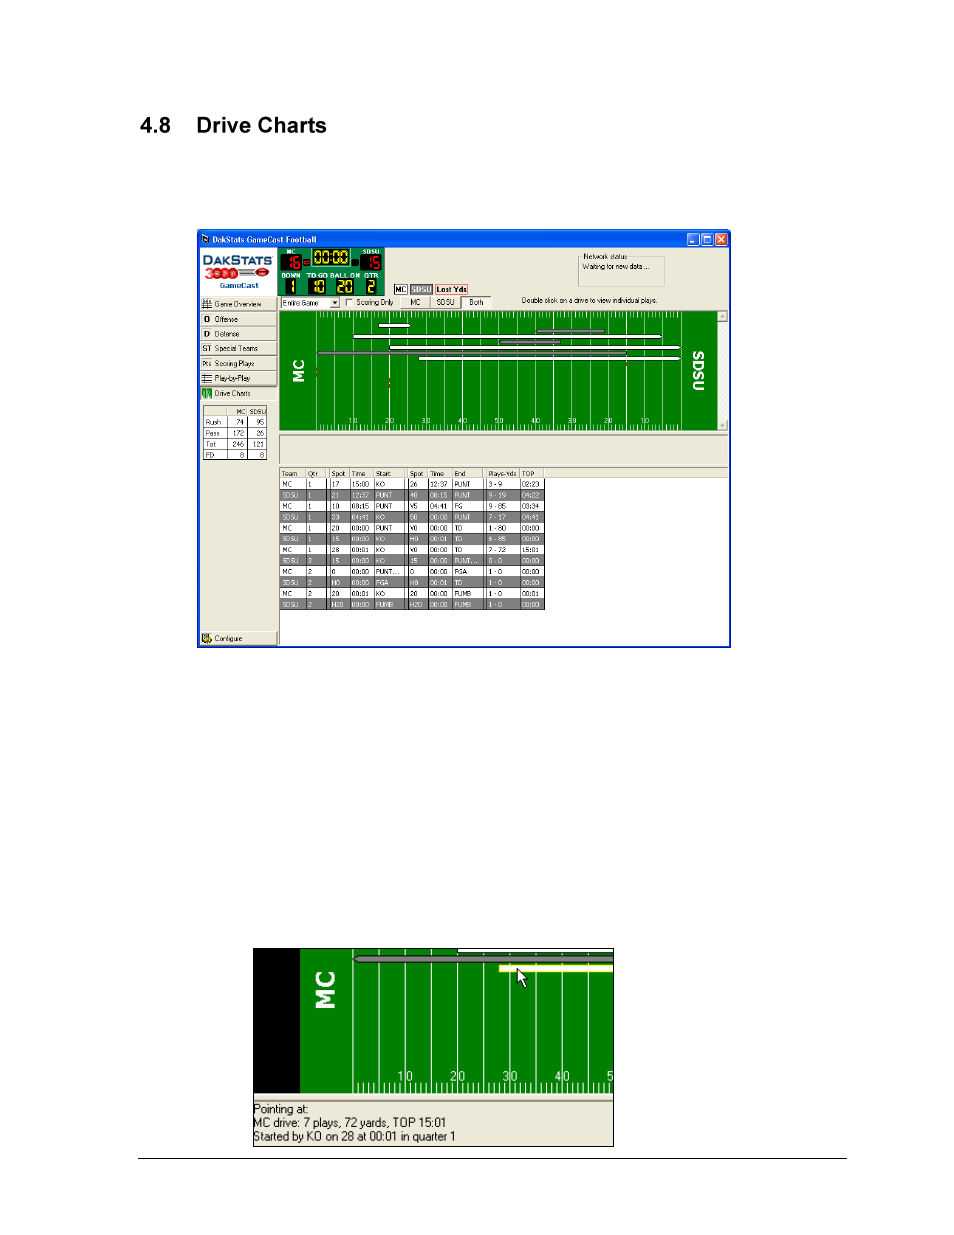
Click Drive Charts to enter the Drive Charts mode (Figure 13). This screen provides a
graphical representation of each drive in the game for both teams, as well as a brief summary
of each drive in the lower half of the screen:
Underneath the scoreboard at the top of the screen, users may select to view the
drives for the Entire Game or by each Quarter.
Click Scoring Only to display just the drives that resulted in a score.
Click on a team abbreviation button or click Both to select specific drives to view.
Alternating colors are used to identify teams in the drive chart and summary:
The home team is shown in white.
The guest team is shown in dark gray.
Note: Plays that resulted in lost yardage are indicated in red.
Hold the cursor over a drive in the chart and additional information about the drive
will appear below the field.
Figure 13: Drive Charts Mode