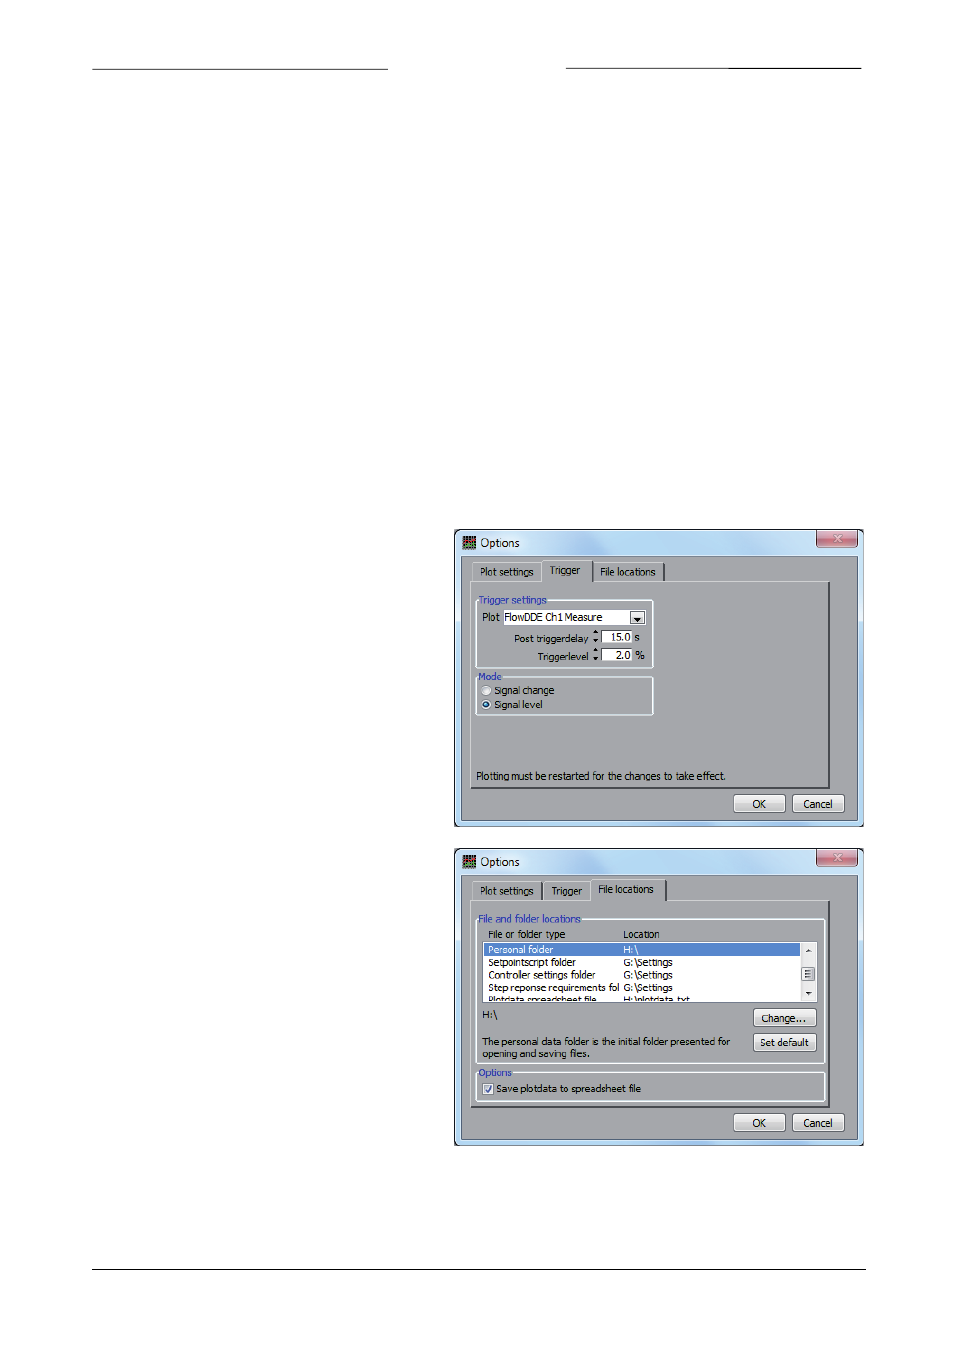
2 trigger, 3 file locations, Trigger – Bronkhorst FlowPlot User Manual
Page 10: File locations, 2 ‘trigger

BRONKHORST
®
At Mode, the way the graph behaves when the plot reaches the ‘end’ of the time axis, can be selected:
-
Scroll: plot lines will be drawn from left to right. As soon as the end of the visible time axis has been
reached, the plot lines will shift to the left, so the first samples will disappear from the screen.
-
Jump visible: plot lines will be drawn from left to right. As soon as the end of the visible time axis has
been reached, the plot will jump plotting continues from the left.
-
Once: plot lines will be drawn from left to right only once. As soon as the end of the total history time
axis has been reached, the plot will stop.
At Colors the color for the Background and Gridlines can be selected.
At Setpoints the values of the setpoints and delta-setpoint selections which can be given manually at the main
window can be adjusted. By clicking Default, the default values will be restored, meaning 100, 80, 20, 5 and 0% for the
fixed setpoints and 5% and -5% for the delta-setpoints.
At Timing settings the Data acquisition interval time can be set, which determines how fast FlowPlot samples values
from DDE. In automatic mode, this will be equal to the FlowDDE poll time, which is recommended in most cases.
The Graph update time is the time which FlowPlot uses to refresh the graph on the screen. If this time is set to a high
value (e.g. 2000 ms), the graph will be refreshed every 2 seconds and several samples will be added per update. In this
case the PC has more CPU time to read samples from the instrument(s), which will result in a higher sample rate. If
this time is set to a low value (e.g. 10 ms), the graph will be updated very often and plotting will look very smooth.
Disadvantage is that there is less time left to read from the instrument(s) because the PC will be busy drawing the
graph on the screen. This will result in a lower
sample rate. By default the graph refresh time is set
to 200 ms.
2.4.2
Trigger
FlowPlot allows stopping the plot after a certain
value or value change has been reached. Several
settings can be made for this.
At Trigger settings the desired plot can be selected to
detect the trigger. The Post trigger delay is the time
after which plotting stops when triggered. The
trigger level is the level at which triggering occurs.
This can be a Signal change or a Signal value.
2.4.3
File locations
Several folders and files can be set to determine
where FlowPlot saves and loads files:
-
Personal folder: this is the initial folder
presented for opening and saving files,
e.g. saving controller settings and
setpoint scripts. Default this will be the
My Documents folder.
-
Setpointscript folder: this is the initial
folder presented for opening setpoint
scripts.
-
Controller settings folder: this is the
initial folder presented for opening
controller settings.
-
Plotdata spreadsheet file: the plotdata
can be stored in a spreadsheet file set
here. The checkbox at Options will allow
the user to enable or disabled the spreadsheet logging.
-
Default setpointscript file: the default setpoint script will be loaded at startup and can be loaded from
the Setpointscript window.
Page 10
FlowPlot
9.17.030
