J*am – Junger Audio J*AM Application Manager User Manual
Page 9
J*AM
6
manual control buttons for EBU R128 style integrated
(program) loudness measurement Start / Pause / Stop.
True Peak:
enable / disable check boxes for the true peak plot and
the respective bar graph. The color dash indicates
the plot colors.
A red warning may be displayed if measurement data
exceeds an allowed range.
S-Term Loud:
enable / disable check boxes for the plot and the
respective bar graph. The color dash indicates
the plot colors.
Manage Graph:
you may pause the live plot display and / or save the
measurement data into a *.csv file.
Besides logging loudness values over the course of time, the major application of the tool is loudness
measurement of programs or parts of it. Following the EBU R128 standard, the Loudness Logger may
measure and display the integrated loudness as well as the loudness range.
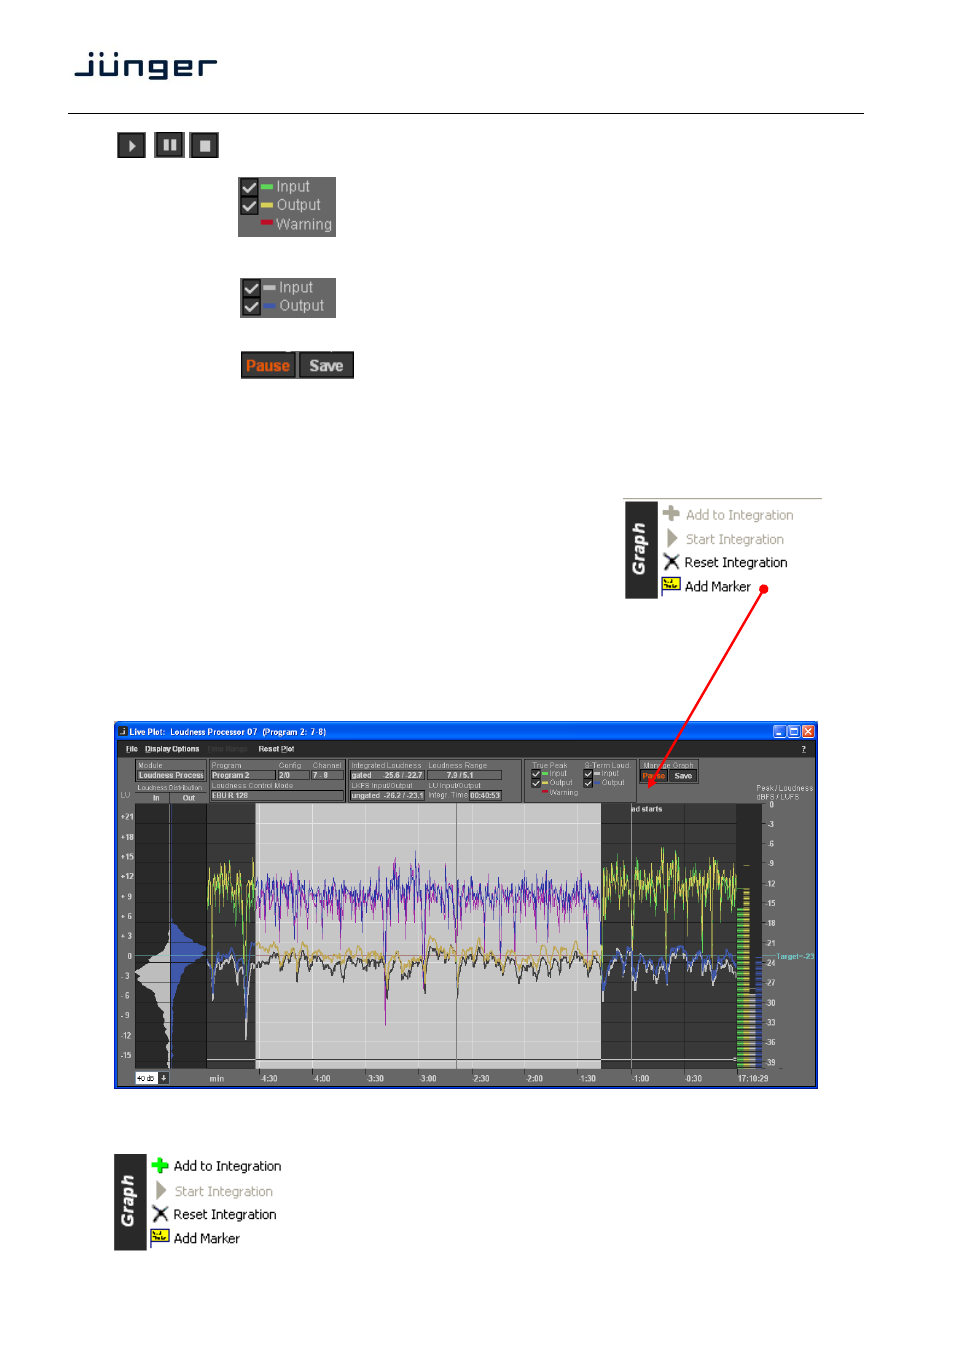
If you place the mouse pointer into the active area of the live plot,
either in pause or in run mode, you see a vertical line.
If you now do a right click you will get such a pop up:
When you click on "Add Marker" a text input window will appear
and you may input a marker (a text) that will from now travel along
with the vertical line. Those kind of markers are inserted automatically
to signal parameter changes such as Loudness Control Mode etc.
Loudness Tool
– Live Plot – mark a region of interest:
You must place the mouse inside the plot window, click the left button and drag the mouse over the region
of interest. When you release the button, the region will be highlighted and a small option pop up opens:
It gives you the choice to add the selected measurement to an integrated
loudness measurement or you may reset the previous integrated
measurement or add a marker.