J*am – Junger Audio J*AM Application Manager User Manual
Page 10
J*AM
7
Loudness Tool
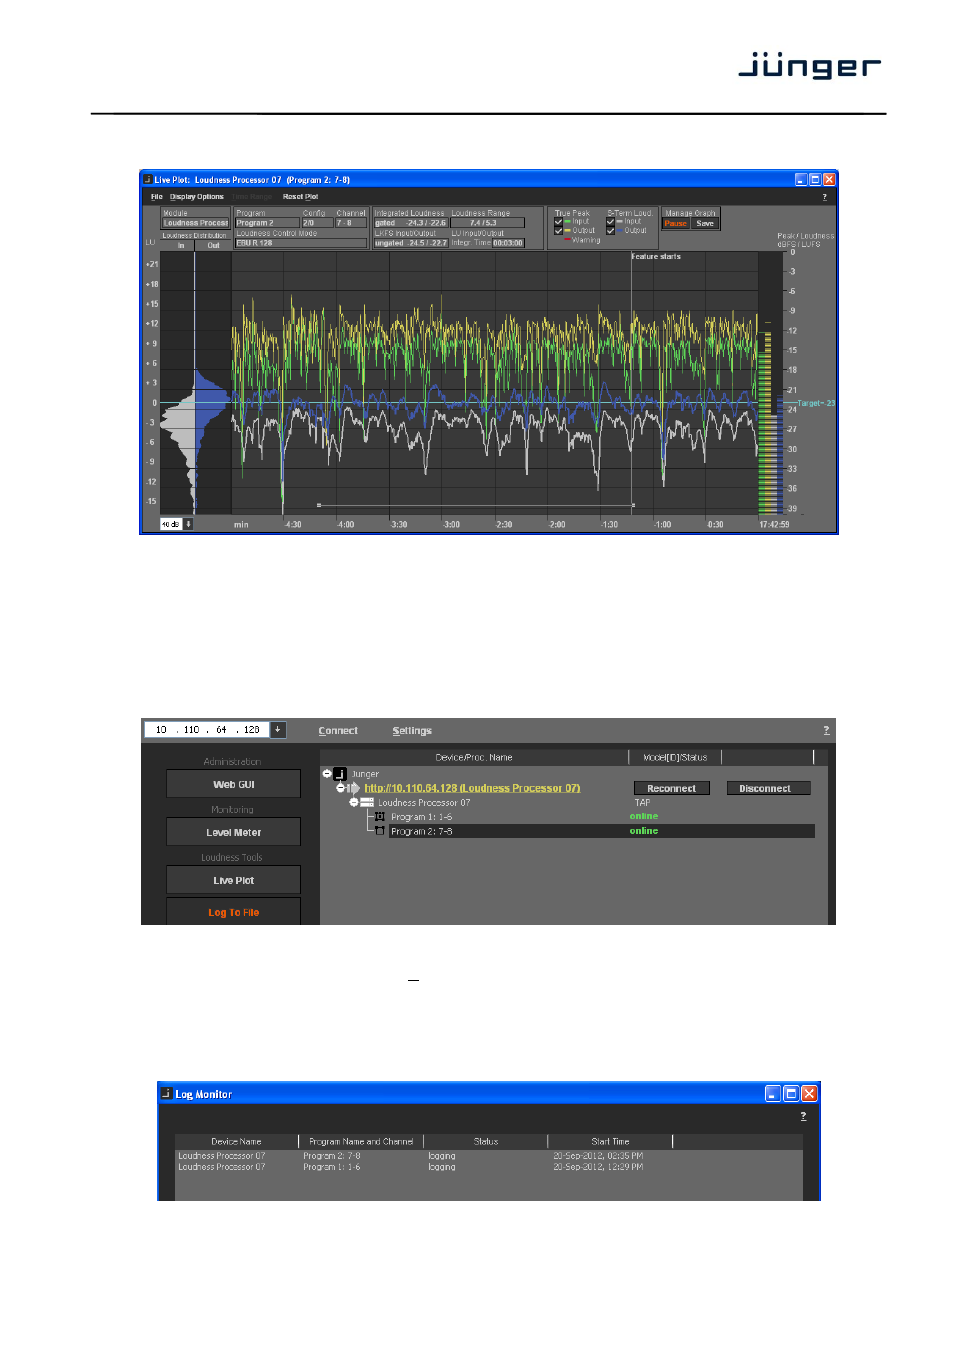
– Live Plot – display of measurement values:
As explained in the previous paragraphs, the values of an integrated loudness measurement will be
displayed in the upper area of the plot. In the bottom of the plot you see a horizontal line that represents the
selected time frame for the measurement. If you select multiple time frames or if you pause and continue
the integrated measurement manually, multiple horizontal lines will be displayed to show the areas which
contribute to the overall result.
Loudness Tools
– Log To File / Log All Programs
For each program detected by the J*AM you may start an independent log file. You can select the folder
where such file will be stored from the Settings menu. The file is a comma separated (*.csv) file.
You may also log all programs of a device or a c8k module which have the status "
online
" by pressing
Loudness Tools
– Log Monitor
The log monitor window simply shows the individual programs of devices and/or c8k modules which are
currently logged to file.