J*am – Junger Audio J*AM Application Manager User Manual
Page 7
J*AM
4
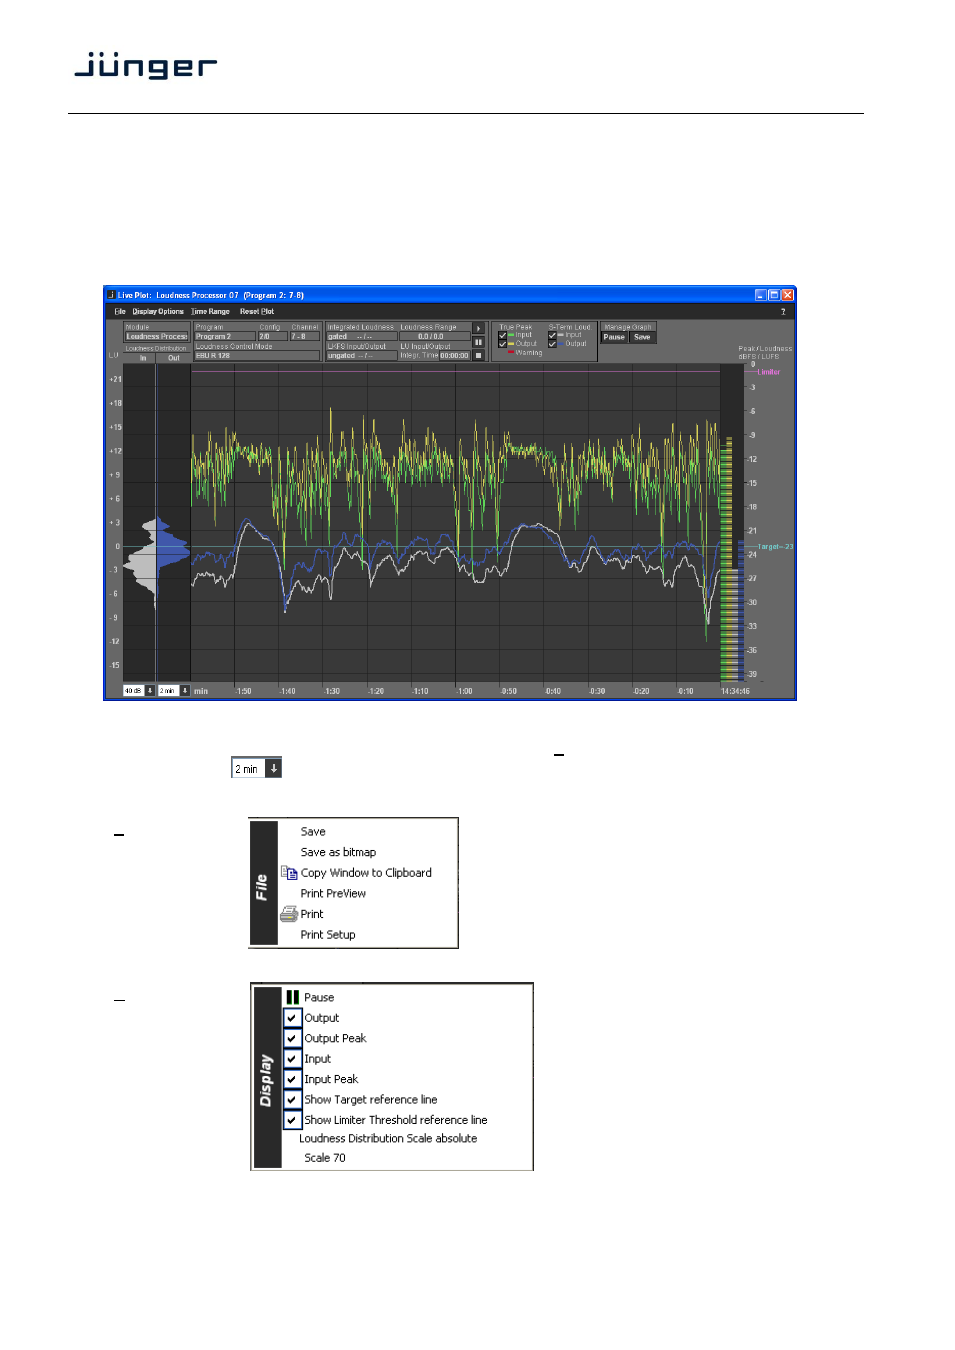
Loudness Tools - Live plot
This tool is meant for live analysis of true peak levels and short term input/output loudness of the pre
selected channel. All relevant information is given at the top of the display. On the right you get a four
column bar graph that shows the true peak values and the short term loudness. These values are
plotted along the time line. On the left hand side you get the statistical distribution of loudness input vs.
output. This unique kind of display is an easy way to see how the loudness processor performs.
The tool keeps all data gathered from the selected processing channel in the PC RAM. This allows you to
change the time scale by selecting it from the pull down menu Time Range or by the pull down box on the
bottom left side:
at any time you like. The tool keeps data for 2 hours in the RAM, for both the input
and the output. After that it starts cycling the data in FIFO (first in first out) style.
File:
will save the live plot measurement data into
a "*.csv" file.
Display Options:
pauses the plot.
disables/enables the respective display for
the short term loudness and true peak plot
for both the input and the output displays.
disables/enables the display of the
respective reference line.
change scale between absolute and relative
change peak/loudness scale between
40 and 70dBFS/LUFS.