How to use the histogram – Casio YC-430 PJ User Manual
Page 117
117
ADVANCED SETTINGS
■
How to Use the Histogram
A histogram is a graph that represents the lightness of an image
in terms of the number of pixels. The vertical axis indicates the
number of pixels, while the horizontal axis indicates lightness.
You can use the histogram to determine whether an image
includes the shadowing (left side), mid tones (center), and
highlighting (right) to bring out sufficient image detail. If the
histogram appears too lopsided for some reason, you can use
EV shift to move it left or right in order to achieve better balance.
Optimum exposure can be achieved by EV shifting so the graph
is as close to the center as possible. The histogram also
includes RGB histogram lines that show the distribution of R
(red), G (green), and B (blue) components. These lines can be
used to determine whether there is too much or too little of each
of the color components in an image.
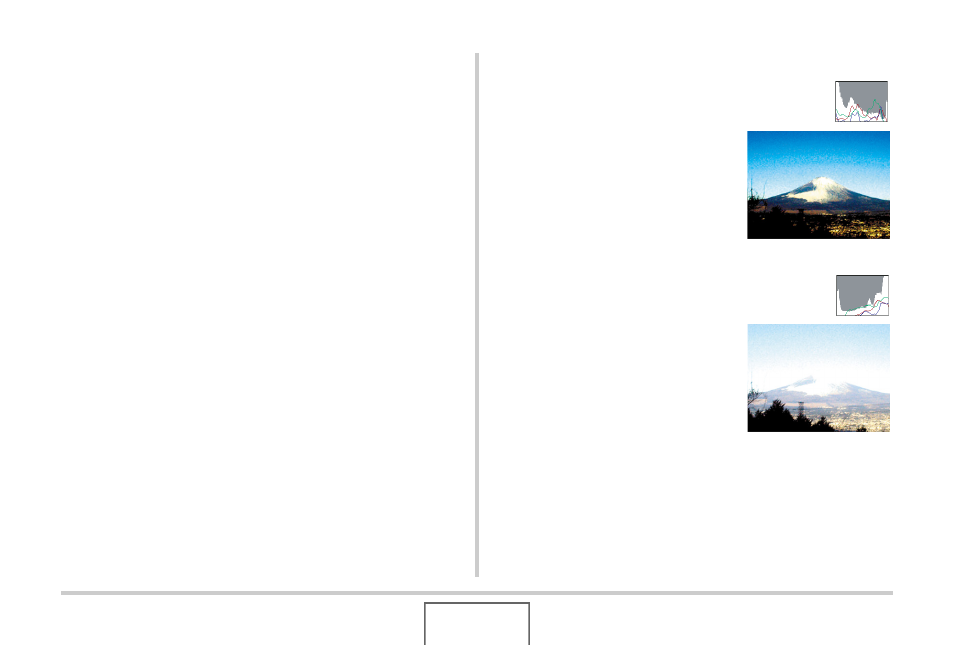
Example Histograms
When the histogram is to the left, it
means that there are too many dark
pixels. This type of histogram results
when the overall image is dark. A
histogram that is too far to the left
may result in “black out” of the dark
areas of an image, as shown in the
nearby image.
When the histogram is to the right, it
means that there are too many light
pixels. This type of histogram results
when the overall image is light. A
histogram that is too far to the right
may result in “white out” of the light
areas of an image, as shown in the
nearby image.