2 sampling controls, 3 results, Sampling controls – Maxim Integrated MAXSANTAFEEVSYS User Manual
Page 9: Results
MAXSANTAFEEVSYS User Manual
4.1.2 Sampling Controls
The GUI provides the user with two options for the sampling of data from the MAXREFDES5. The Sample
button captures a discrete number of samples as selected in the No. of Samples drop down menu and
displays the results. To start continuously collecting and displaying measurement data, press the Sample
Continuously button. When enabled, the button changes its text to Stop Sampling. In this mode, the No. of
Samples value determines the time base for displayed results. For best GUI performance, do not set the No.
of Samples above 16384.
The Sample Rate drop down selection allows the user to choose the sample rate or the number of
conversions initiated by the GUI per second. The max allowable sample rate is determined by the MAX1301
device.
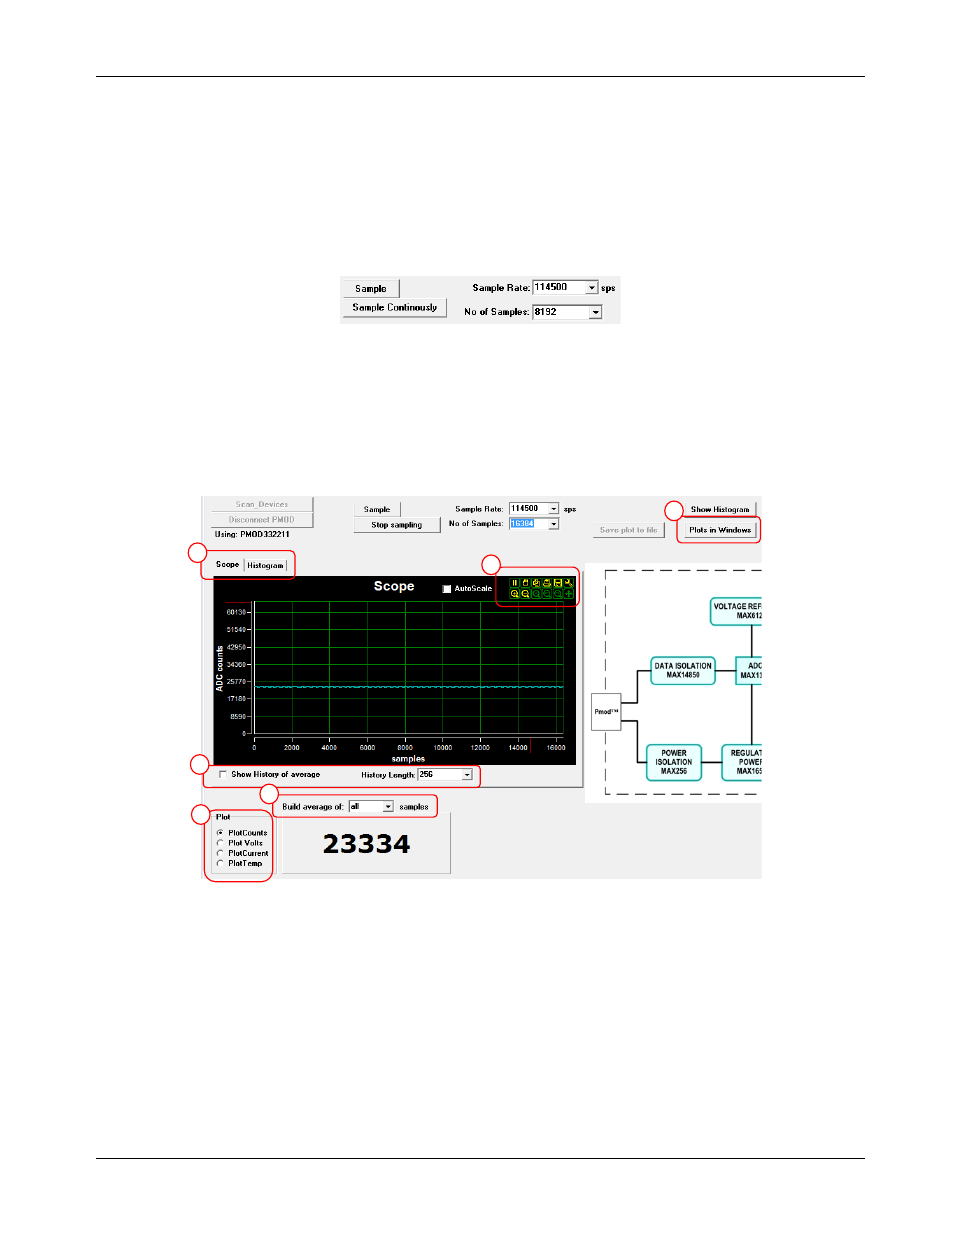
4.1.3 Results
The real-time scope on the left side of the GUI represents the measured data with No. of Samples used for
the x-axis as described in the section above. This section describes the rest of the GUI display controls, which
execute no control or command of the MAX1301 device.
1) Scope | Histogram: This tab allows the user to choose between the Scope plot with configurable x-
and y-axis or the Histogram plot with the ADC code on the x-axis and the number of occurrences on
the y-axis.
2) Show History of average: Checking this option allows the user to view entire data in history up to the
history length selected in the History Length drop-down menu.
3) Averaging: A Build average of drop-down menu is also provided for the number of discrete samples
to average for each displayed data point.
1
5
6
4
2
3
Rev 0
9