Maxim Integrated MAX11300PMB1 Peripheral Module and Munich (USB2PMB1) Adapter Board User Manual
Page 28
MAX11300PMB1 Peripheral Module and Munich (USB2PMB1) Adapter Board Quick Start Guide
2. Adjust the potentiometer and observe the amplitude received at the ADC changes
as the potentiometer is varied.
3. In drop-down menu at the top right, select P1_DAC+ADC_0>+10V and select the
Get plot box button. Another plot window opens and displays two waveforms: one
in teal and one in purple. The teal waveform is for ADC, and the purple waveform is
for DAC. Click on Read DAC File and open the ideal_triangle_1000_3x.adc file.
The purple DAC waveform shows a triangle as driven into the DAC. The teal plot
shows the waveform as sampled with the ADC on that same pin. Zoom in or make
the plot window full screen to see the difference between the ADC and DAC plots,
which is mostly due to timing. DAC allows current up to ~20mA; if more current is
drawn, the DAC voltage drops. This happens if the DAC has an output voltage of
10V with a load resistor of 50
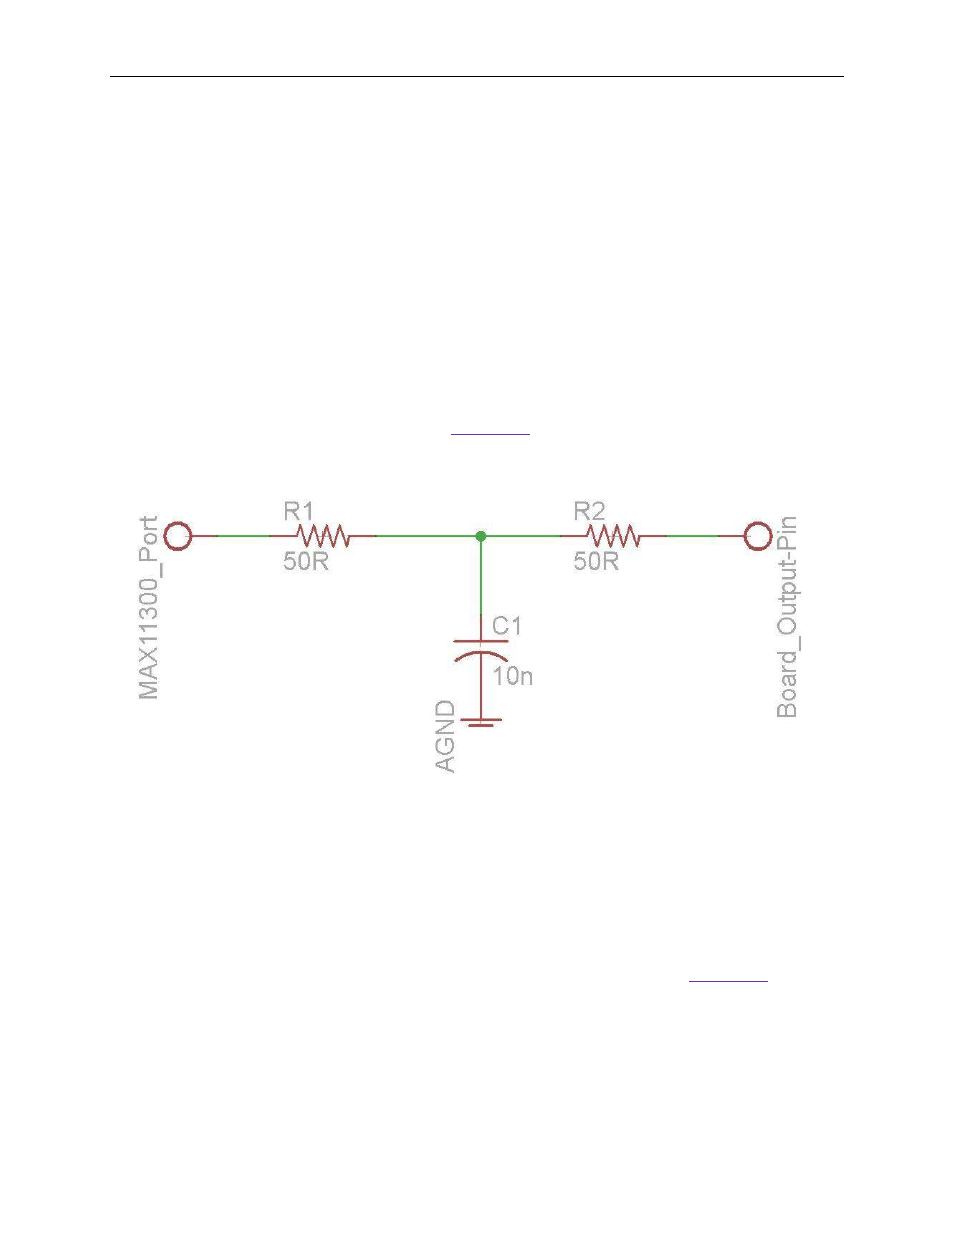
0Ω or less. On the MAX11300PMB1 board, an RC filter
is installed on every port as shown in
Figure 30. RC Filters Are Installed on the MAX11300PMB1 Ports (P0–P19)
This filter is not necessary to use the device, but it provides short-circuit protection. On
this board, it is acceptable to connect a jumper between P1 and the middle row (GND).
Connect a jumper between P1 and GND and observe that the DAC does not reach the
peak of the triangle waveform that is driven into the DAC as shown in
28