Large scatter plot in plot manager – ChemoMetec NC-250 User Manual
Page 38
991-0252 Rev. 1.1
February 2013
38
Double-click: To launch the large scatter plot double-click in the plot area. In the large scatter plot you can
define axis parameters, polygons, quadrants and gating settings.
Right-click: Shows the context menu offering the following options:
Show large plot (dbl-click)
Copy BMP to clipboard
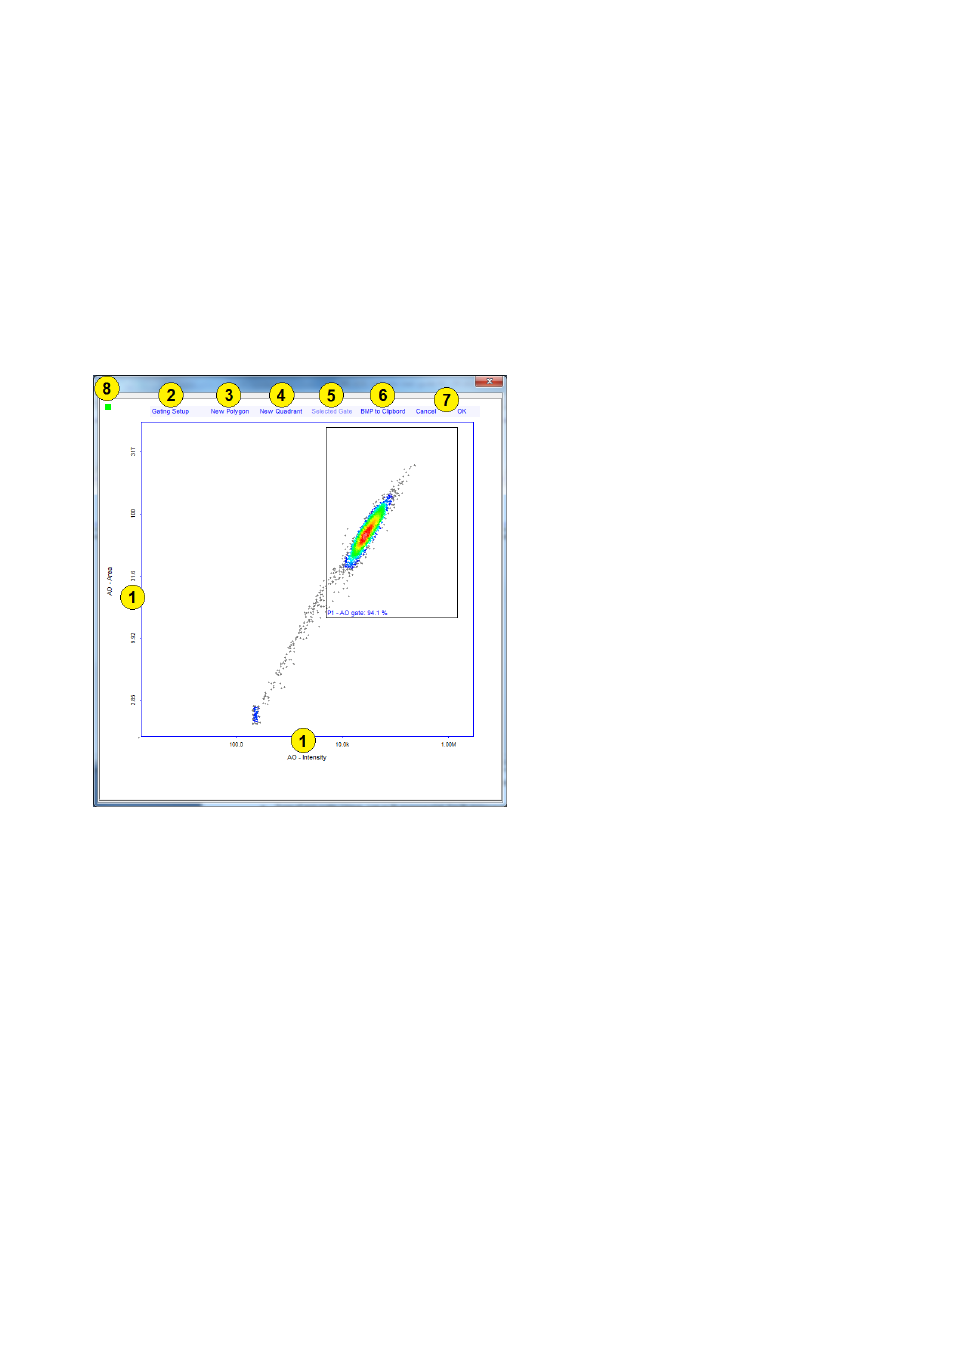
Large Scatter Plot in Plot Manager
The large scatter plot is used to set axis parameters, add or edit polygons and quadrants and define gating
settings.
1. Axis Settings: By clicking on either the y-axis or x-axis it is possible to select type of axis scale, image
channel, parameter type and axis limits.
Type of axis: Linear, Log or Bi-exponential. For Bi-exponential it is possible to edit the below
zero scale value.
Image channel: Names of the available channels.
Parameter types: The available parameters depends on the protocol used to generate the *.cm
file.
2. Gating Setup: Launches the ‘Gate Configuration’ window, where gating settings can be configured
for this plot.
Note: Any polygons or quadrants which have been created in this large scatter plot must be saved
to the row before it is possible to set gate configuration for them (see below for further details).
3. New Polygon: Creates a new polygon. Click in the plot area to add points in the polygon.