Large histogram plot in plot manager – ChemoMetec NC-250 User Manual
Page 35
991-0252 Rev. 1.1
February 2013
35
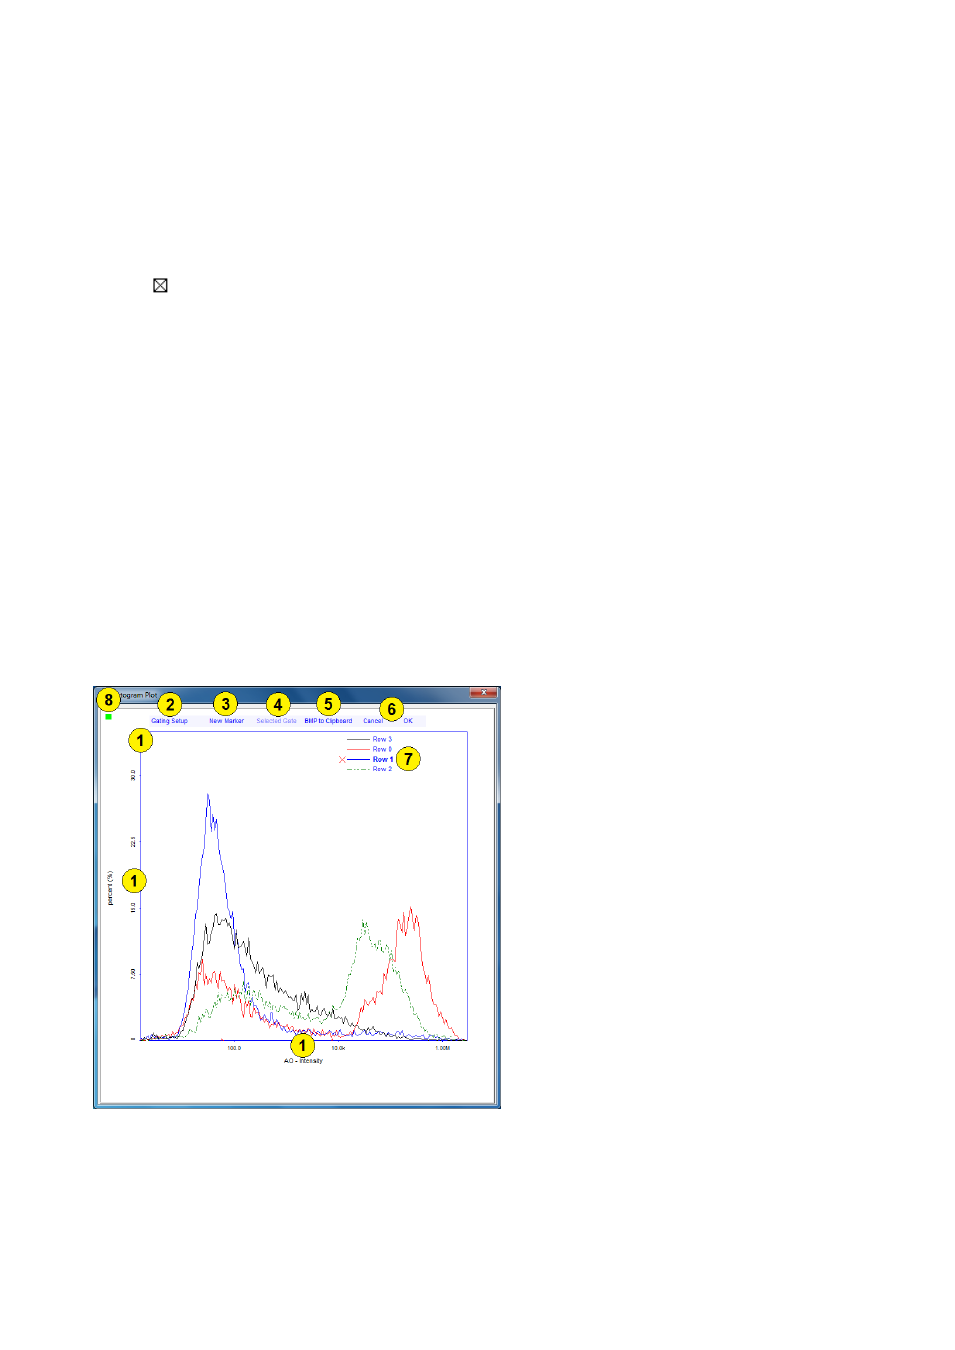
histogram from another row (blue).
1. Data source indicator: A small colored square in the upper left corner indicates the source of the
cell population (see further details in the section Row Window in Plot Manager).
2.
Click the ‘delete plot’ button to remove a plot from the row. This will leave an empty area in
which you may, via right-click, insert another plot or simply delete the area.
Double-click: To launch the large histogram plot, double-click in the plot area. In the large histogram plot
you can define axis parameters, markers and gating settings.
Right-click: Shows the context menu offering the following options:
Show large plot (dbl-click)
Copy BMP to clipboard
Copy Histogram
Paste Histogram
Copy Histogram and Paste Histogram options may be used to insert and overlay histograms from other
histogram plots.
Large Histogram Plot in Plot Manager
The large histogram plot is used to set axis parameters, edit marker sets, define gating settings and add
overlay histograms.