EdgeWare FastBreak Pro Version 5 User Manual
Page 68
68
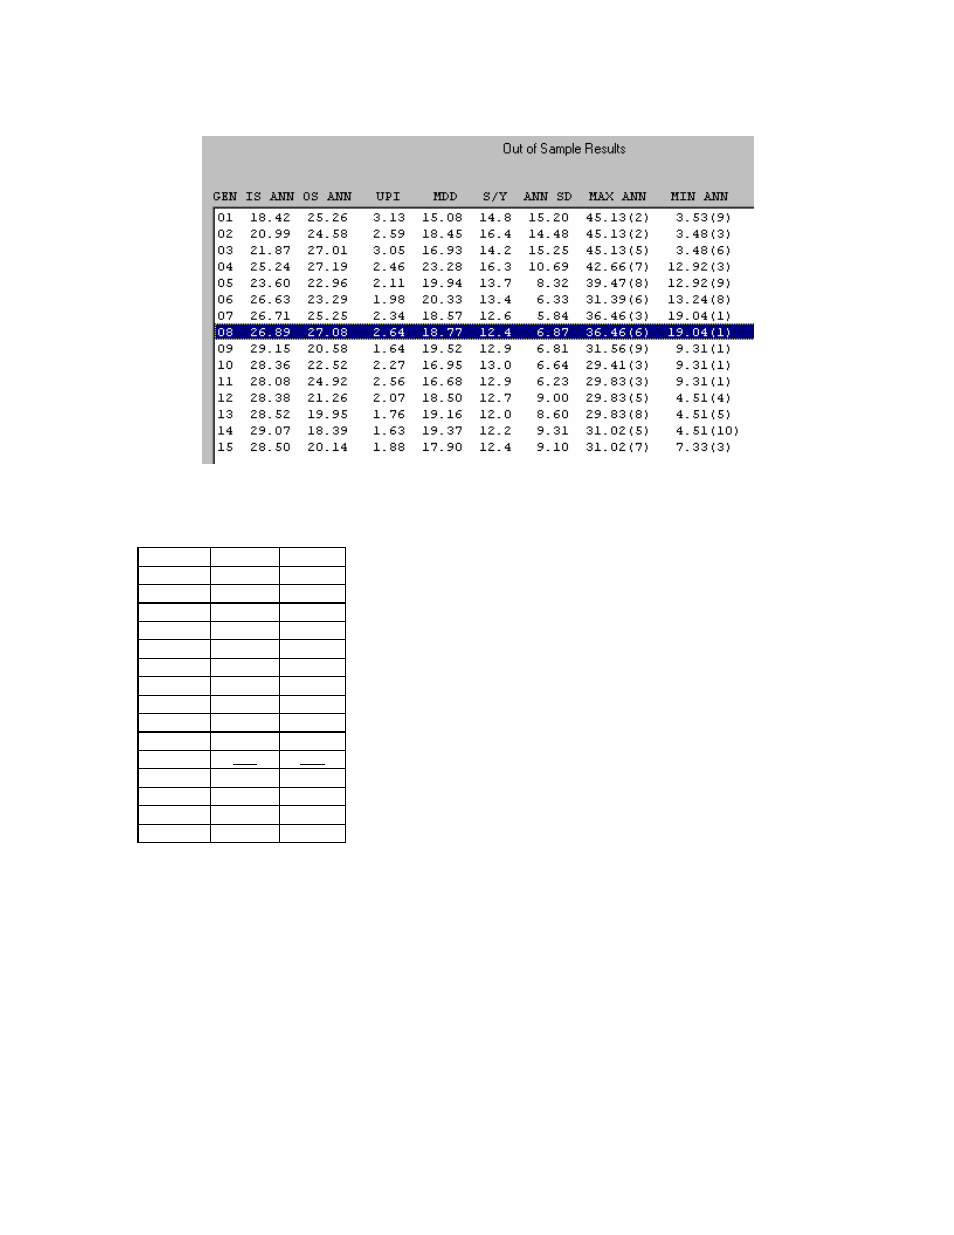
Generation 8 was selected for detailed analysis. Here are the results (using FNU equity
curves):
System
OS Return Post OS
Number
Annual, % Annual, %
1 27.8
51.4
2 27.8
54.6
3 12.5
46.1
4 22.9
58.6
5 30.7
67.2
6 36.1
54.8
7 32.5
58.4
8 38.6
40.9
9 36.3
31.2
10 38.7 51.4
Average 31.5 52.1
S&P 37.2
14.7
Family Avg.
11.6
6.3
These are outstanding results, especially considering less than four years of data was used
for optimization.