EdgeWare FastBreak Pro Version 5 User Manual
Page 63
63
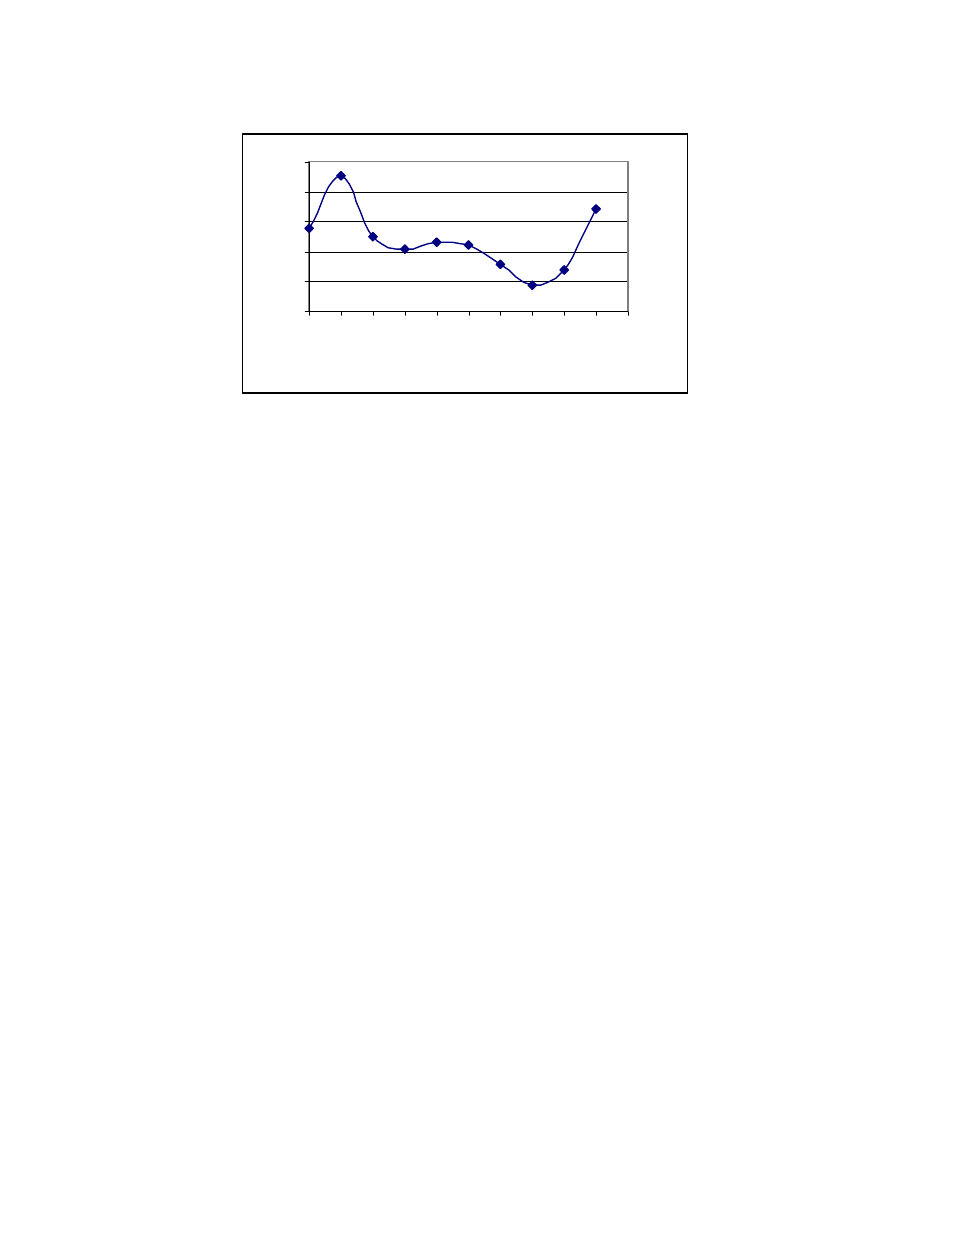
What is very clear is that in the early to mid 90’s, it appears that your chance for out-
performance was much better. The ratio hit a low in the June 1996 – June 1997 time
period where the optimum systems actually under performed B&H. The tide seems to
have turned in recent years.
There are several theories as to why this change would have happened. Our favorite is
that the investors and fund managers are much “quicker on the trigger” in recent years.
When money quickly leaves one sector and goes to another sector, it can leave medium-
period trend following systems in a whipsaw.
You need to be aware of the above information when you are looking at year-to-year
performance. Do not be discouraged if your sector trading systems perform poorly in the
June 96-97 time period.
Trading Growth Funds
We believe that too much emphasis has been placed on “Sector Rotation,” and that it is
much easier, and just as profitable, to develop trading systems that invest in more
diversified funds such as growth funds. We built a trading family of 44 aggressive and
small cap growth funds that are generally available to trade without transaction fees. Our
system held two funds, with an MDD goal of 15%, IS date range of 6/19/1989 to
12/31/1997, OS date range between 1/2/1998 to 10/20/1999. We limited the number of
switches to 18 per year. We tried optimization with a variety of options in FastBreak
Pro, including mutation percentages, robustness variable, etc. The IS returns were
approximately 30%/year, and the OS performance was generally in the 50%-60%/year
range. The MDD OS was typically in the 15%-20% range. This is encouraging because
the OS date range included the severe sell off in the third quarter of 1998.
0.0
1.0
2.0
3.0
4.0
5.0
199
0
199
1
199
2
199
3
199
4
199
5
199
6
199
7
199
8
199
9
200
0
End Date
Trade Return/B&H