EdgeWare FastBreak Pro Version 5 User Manual
Page 59
59
Keeping Track of Optimization Runs
It is useful to keep a simple record of optimization runs. Although it is a simple matter to
reload the restart file or optimization parameters file to check parameter choices and
ranges, we find it useful to keep a simple spreadsheet record of runs. The spreadsheet
can be filled out in less than a minute when an optimization run completes. Here is an
example of the format we use for keeping records:
IS
OS
1/4/93 to 10/1/96
10/1/96 to 4/1/98
Case Gens Funds Best IS
OS UPI MDD
S/Y
Max
Min Notes
Exp1 6
3
2
21.4
30.3
3.24
22.24
34.7
52.97
6.26 5%
Mutation
2 15 3 8
24.2 34.9
3.29
22.54
36.3
46.98
9.7 10%
Mutation
Note: The following studies were made with earlier versions of FastBreak Pro. You
may get somewhat different results if you recreate the studies, but we wanted to share
with you some of the issues we studied.
Over-optimization
The trading system developer should always be wary of over-optimization. The GA
optimizer will continue to look for better combinations of parameters that give
increasingly better results in the In-Sample (IS) time period. This is certainly important
because we know that a system that performs poorly in the past is unlikely to perform
well in the future. When we begin to see that the evolved systems do not have good
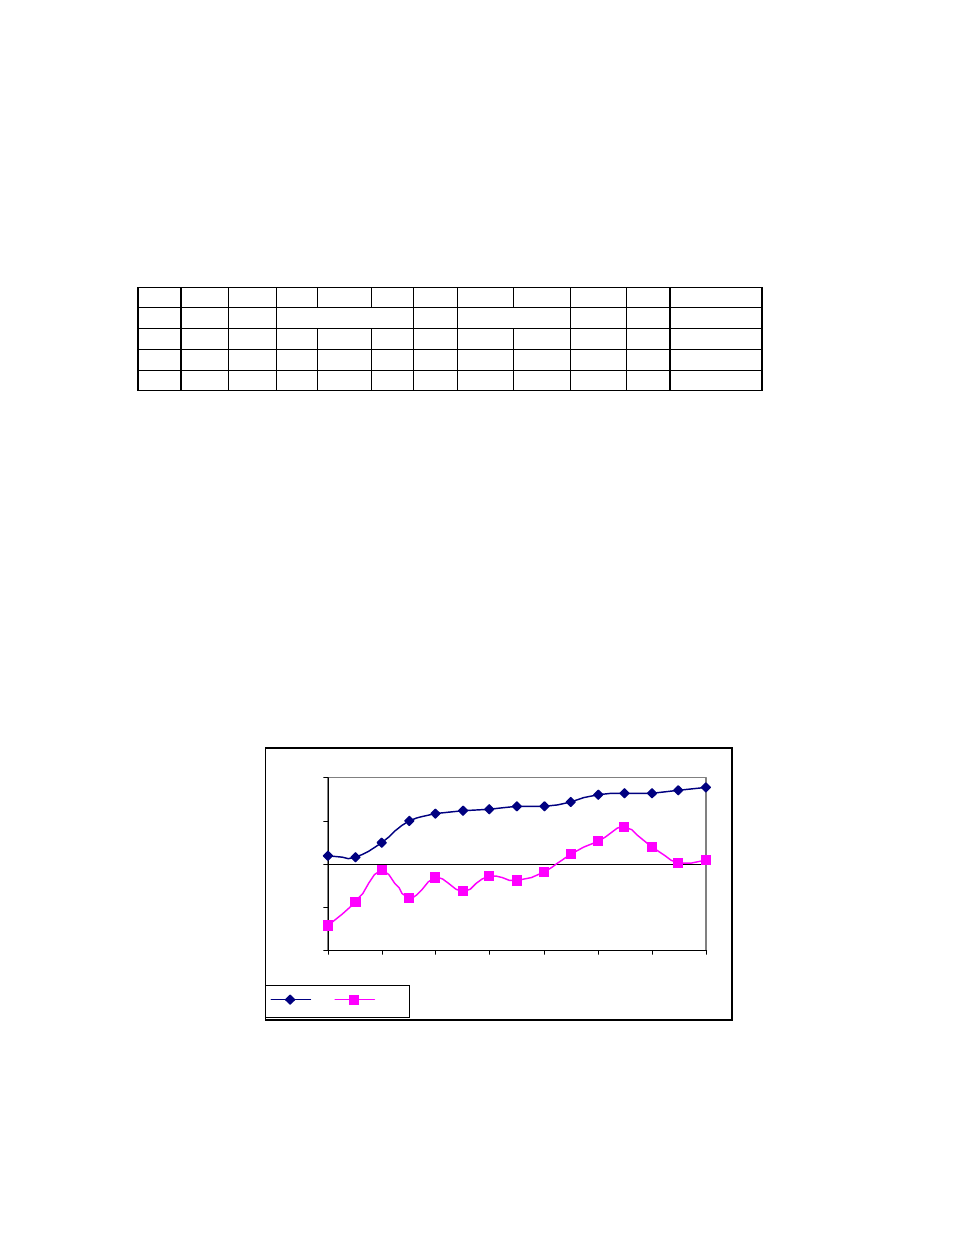
predictive power, it is time to stop optimization. Here is a chart from an optimization run
that holds three Fidelity Select funds:
The IS average return has a smooth increase as the GA finds better parameters each
generation. The OS return is less smooth, but we see that at in the 12
th
generation a peak
appears. This is not to say that if we allow the GA to continue it will not find a better
15
20
25
30
35
1
3
5
7
9
11
13
15
Generation
OS Return, %/year
IS
OS