3 standard curve chart – Bio-Rad iQ™5 Optical System Software, Version 2.1 User Manual
Page 62
Section 6 Data Analysis Module
- 53 -
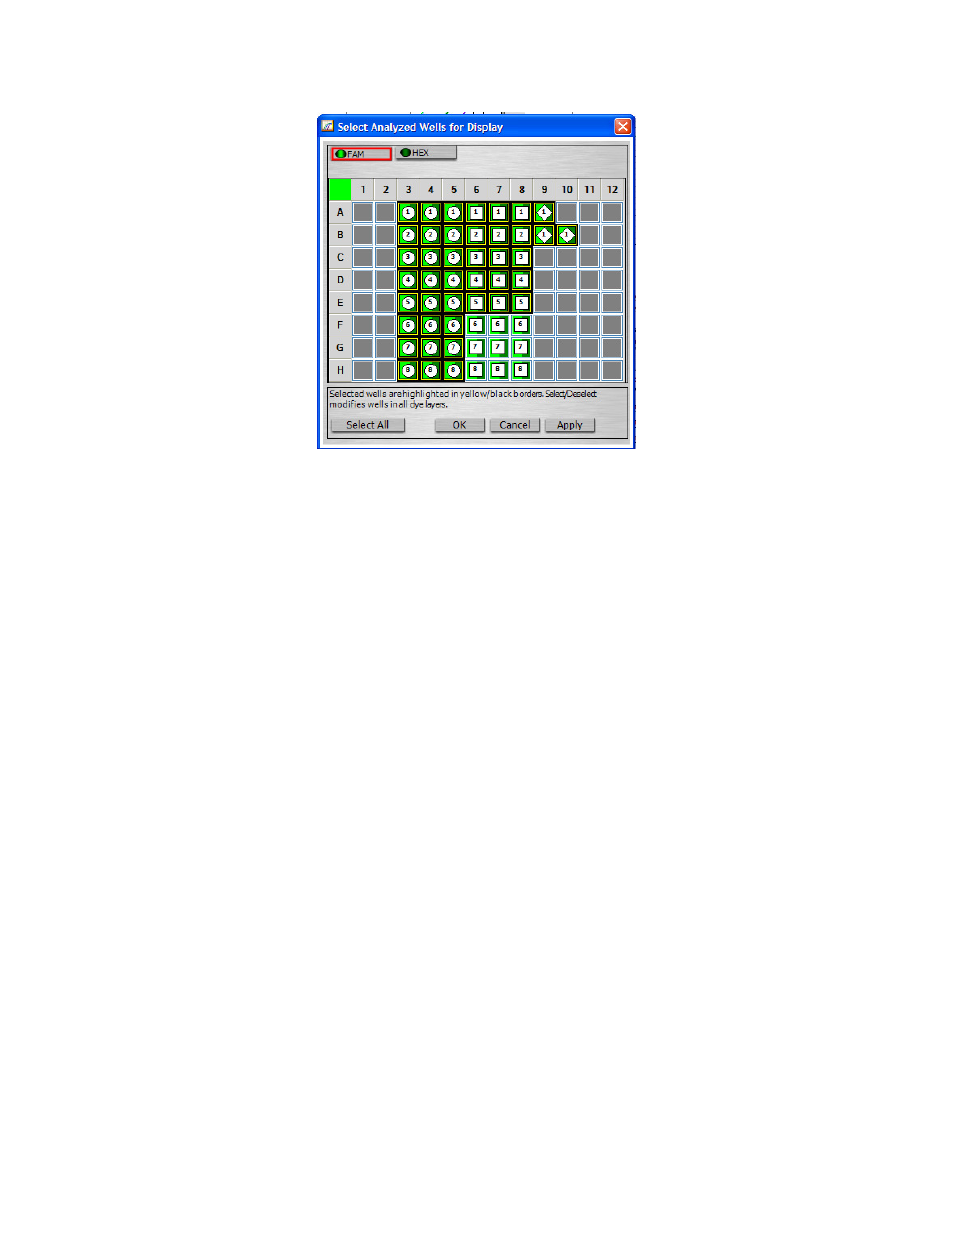
Fig. 6.6. The Select Analyzed Wells for Display Window.
To select the wells to include in data display:
1. In the PCR Quant tab, click Display Wells. The Select Analyzed Wells for Display
window appears. Only those wells that are included in the analysis appear in the window.
2. Select and de-select wells using the same methods described in the analyze wells section
on page 51.
3. After you determine which wells to include in analysis, click Apply if you want the Select
Analyzed Wells for Display window to remain open after the iQ5 software re-analyzes the
wells. If you are satisfied with your selection, click OK to close the window and update
the wells to include in the analysis. If you click Cancel, the iQ5 software closes the
window and discards all changes.
The Select Analyzed Wells for Display window displays traces for fluorophores with parameters
per the selected fluorophore selector buttons on the amplification chart. You can use this dialog
box to select all wells for display. Restore all traces for display by right-clicking on the
amplification chart and clicking Show All Traces in the menu.
6.3 Standard Curve Chart
The standard curve chart appears when, for a given fluorophore, more than 2 standards (with
different quantities) are defined in the plate setup. The fluorophore selector buttons on the
amplification chart determine which fluorophores appear in the standard curve chart shown
below in Figure 6.7.
The bottom of the chart displays a legend that includes:
•
The color used to plot each fluorophore
•
The name of the fluorophore
•
The efficiency of the reaction
•
The coefficient of determination (R
2
)