2 amplification chart – Bio-Rad iQ™5 Optical System Software, Version 2.1 User Manual
Page 58
Section 6 Data Analysis Module
- 49 -
The PCR Quant tab consists of three sections:
•
Amplification chart
•
Standard Curve chart
•
Results section
6.1.1 Customizing the PCR Quant Display
You can customize the size of the sections in the PCR Quant tab in a number of ways. In the
upper corner of each section is a + (plus) button that enlarges the section when clicked. The
enlarged section has a – (minus) button that reduces the section when clicked. You can move
divider bars between each section by clicking and dragging on the divider bar to resize panes to a
specific size.
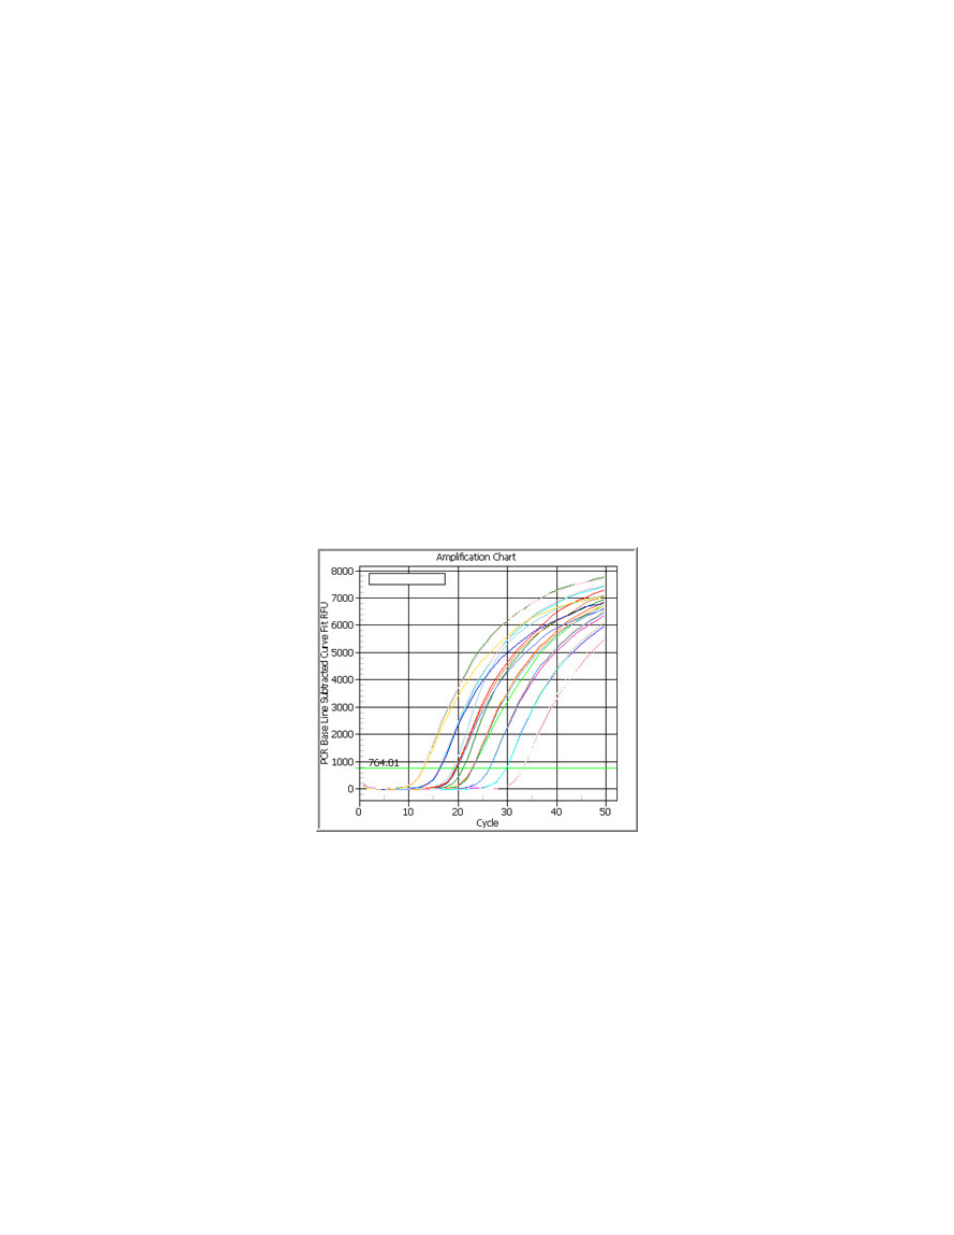
6.2 Amplification Chart
The amplification chart (Figure 6.2) displays the relative fluorescence for each well at every cycle.
Each trace represents the fluorescence of a given fluorophore for a single well and at each cycle
a single data point is plotted which is the calculated mean of the data collected for that well
during the particular cycle. The data that is used to determine this mean point is set by the Set
Data Analysis window dialog box. The data can be plotted in Background Subtracted, PCR Base
Line Subtracted, or PCR Base Line Subtracted Curve Fit mode.
Fig. 6.2. The Amplification Chart.
6.2.1 Fluorophore Selector Buttons
Selecting Fluorophores to Display
You can use the fluorophore selector buttons, which are located under the amplification chart, to
display which fluorophores appear in the amplification and standard curve charts. Selecting a
single fluorophore is useful for determining the analysis parameters for that fluorophore.
Selecting all fluorophores can be useful for ensuring that the efficiencies of each fluorophore set
are approximately equal.