2 viewing clustering plots (2d amplitude) – Bio-Rad QX100™ Droplet Digital™ PCR System User Manual
Page 23
QX100 Droplet Reader and QuantaSoft Software Instruction Manual
| 17
Chapter 3 Using QuantaSoft Software
Chapter 3 Using QuantaSoft Software
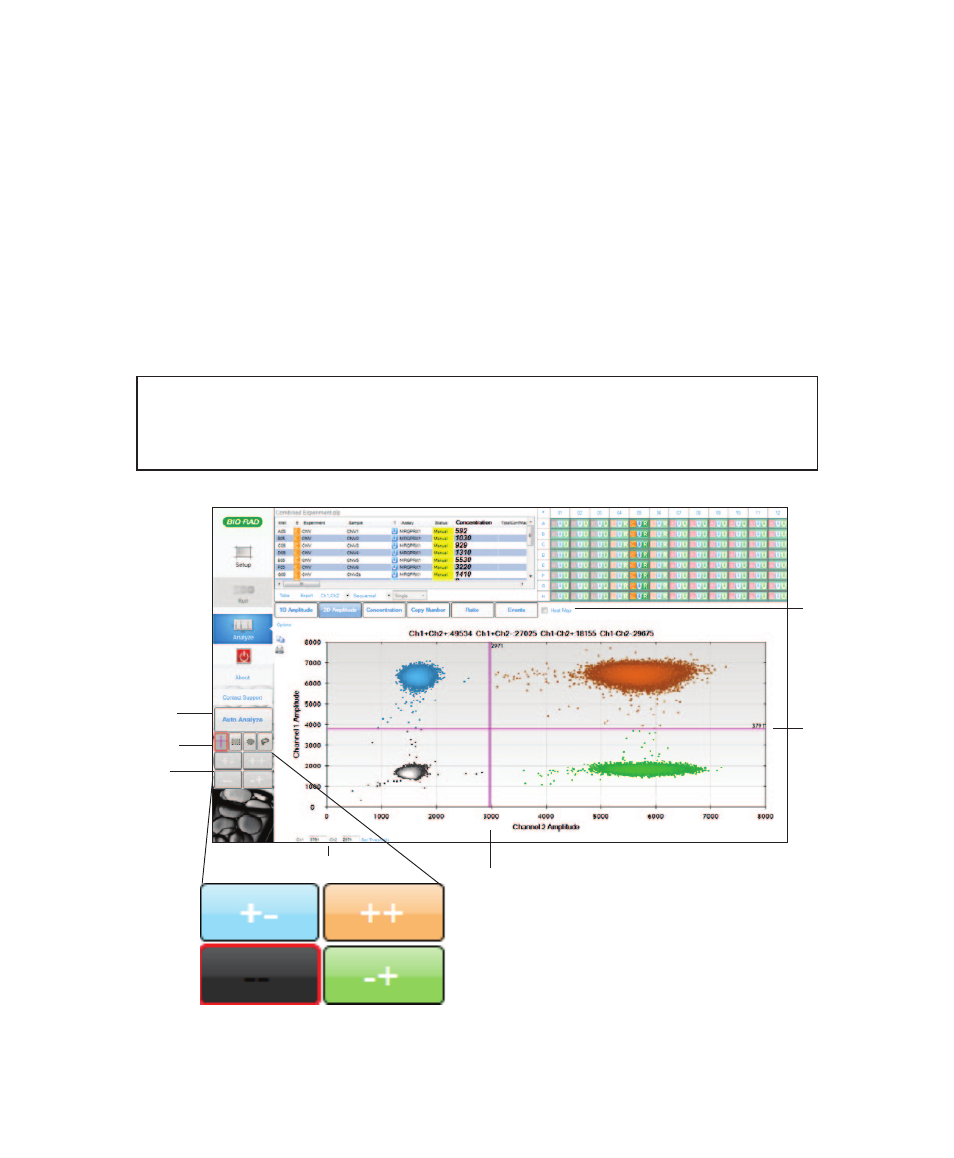
3.3.2 Viewing Clustering Plots (2D Amplitude)
Click 2D Amplitude to view the channel 1 vs. channel 2 clustering plot and enable options for manually or
automatically adjusting the thresholds used in assigning positives and negatives for each detection channel.
Patterns observed in these plots can also indicate interactions between PCR products in the reactions.
■
■
To automatically assign thresholds for positives and negatives, click Auto Analyze
■
■
To manually assign thresholds:
– Use the thresholding crosshair to assign classification regions for the whole plot
– Use the ellipse, rectangle, or lasso classification tool to classify a region of the plot. Click the tool, then
click the region type in the working cluster selector. Use the classification tool to select the region within
the plot
Tip:
Mouse over any well in the well selector to transiently superimpose data from that well
in the clustering plot.
Viewing clustering plots. Threshold adjustment options available in the clustering plot are shown. Threshold values are indicated by
the pink lines in the plot.
Manual classification
tools
Ch2 threshold
Ch 1
threshold
Working cluster
selector
Ch1+/Ch2–
Ch1+/Ch2+
Ch1–/Ch2–
Ch1–/Ch2+
Ch1+/Ch2–
Ch1+/Ch2+
Ch1–/Ch2+
Ch1–/Ch2–
Automatic
classification tool
Threshold settings
Display
multicolor
heat map