3 analyze – Bio-Rad QX100™ Droplet Digital™ PCR System User Manual
Page 20
14 |
Chapter 3 Using QuantaSoft Software
QX100 Droplet Reader and QuantaSoft Software Instruction Manual
3.3 Analyze
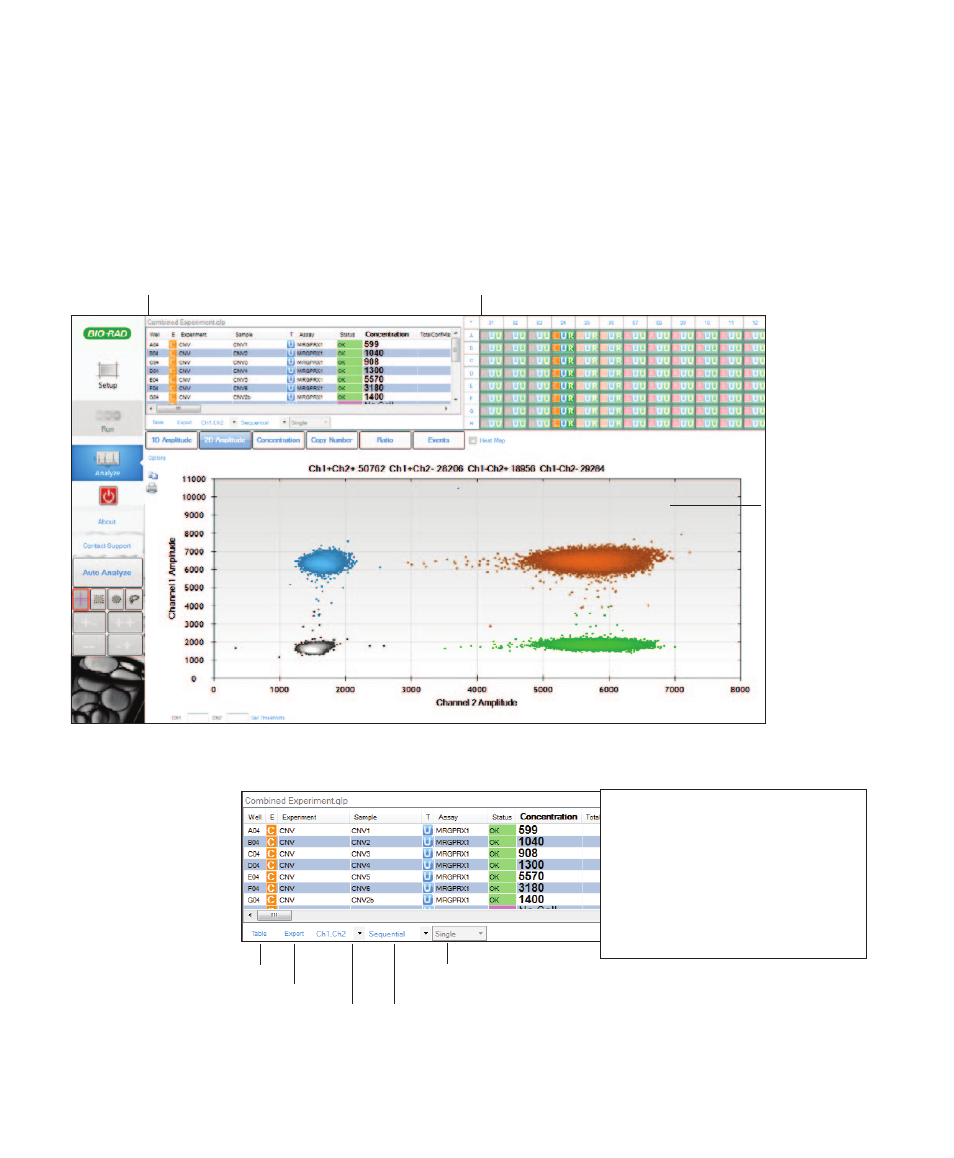
In the Setup window, load a plate (filename.qlp), then click Analyze to open and analyze the data. The data
analysis interface is separated into three windows:
■
■
Results table — summarizes results for wells selected in the well selector
■
■
Well selector — enables selection of wells for targeted analysis
■
■
Processed data/graphical display — allows visualization of graphical data from selected wells
Data analysis interface. Data from a CNV analysis are shown.
Graphical data
display
View table in graphical display window
Export data to .csv file
Select data from detector channel(s)
Toggle order in which channel data are displayed in the table
Display replicates separately, as merged wells (if Sample Name, Experiment, and
Assay Name and Type all match across the wells), or both
Results table options. Data from a CNV analysis are shown.
Results table
Well selector
Status options:
OK — automatic analysis successful
CHECK — automatic analysis unsuccessful; to
view concentration, use manual analysis
tools
Multi — data automatically analyzed as part of a
multi-well selection
Manual — droplets analyzed manually