Bio-Rad QX100™ Droplet Digital™ PCR System User Manual
Page 22
16 |
QX100 Droplet Reader and QuantaSoft Software Instruction Manual
Chapter 3 Using QuantaSoft Software
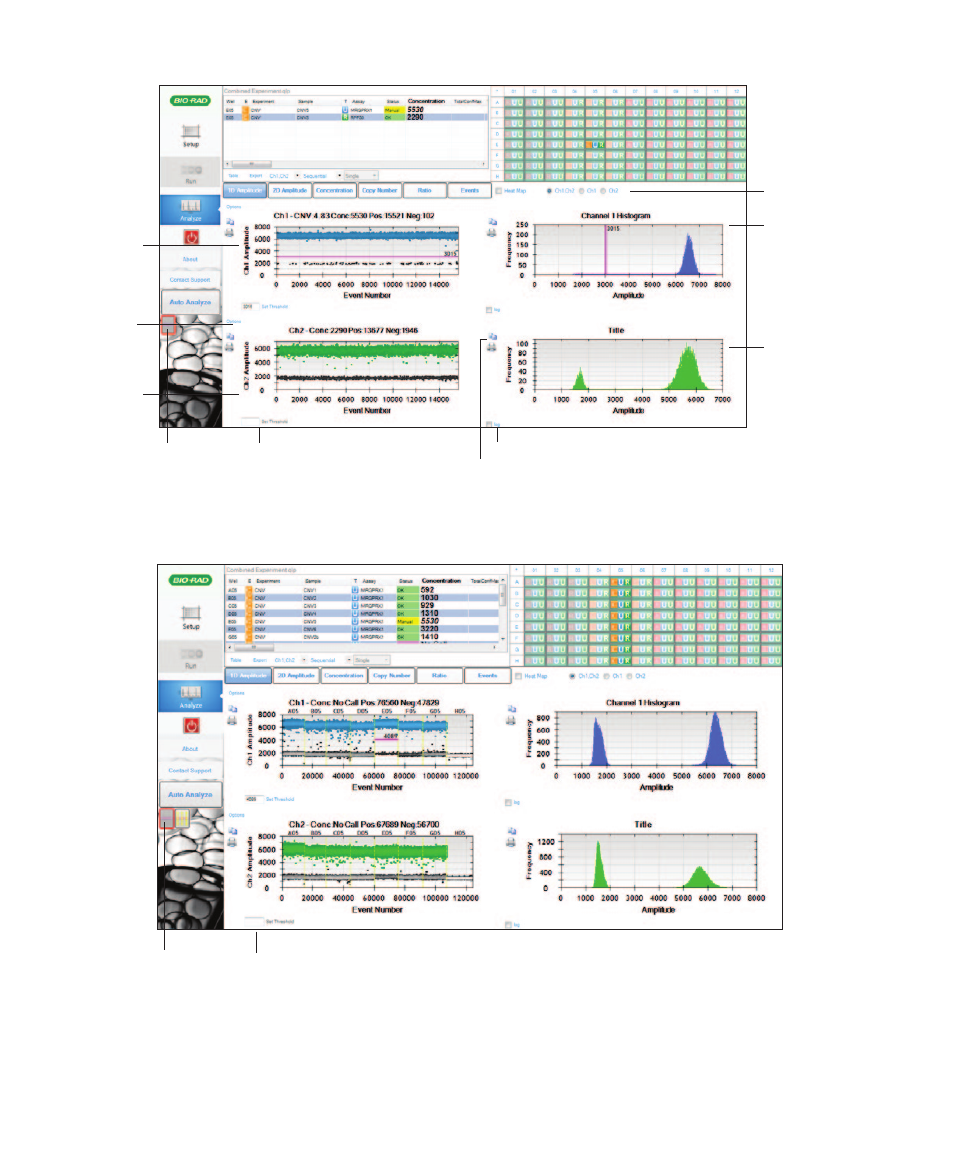
Channel 1
fluorescence
amplitude vs.
event number
Channel 2
fluorescence
amplitude vs.
event number
Channel 1 (FAM)
histogram of events
vs. amplitude
Channel 2 (VIC or
HEX) histogram of
events vs. amplitude
Y-axis log scale toggle
Threshold settings
Y-axis display
options
Copy graph to clipboard or print
Viewing channel data for a single well. Processed data from both channels of a single well are shown. In channel 1, the single-well
threshold tool is enabled (the threshold is shown by the pink line and the value in the Set Threshold field).
Channel selector
Threshold setting
Viewing channel data for multiple wells. Processed data from both channels of multiple wells are shown. In channel 1, the single-well
threshold tool is enabled (the threshold is indicated by the pink line and the value in the Set Threshold field; the status of that well in the
results also shows Manual).
Threshold adjustment tool
(single well)
Threshold adjustment tools