SATEC RGM180 User Manual
Page 17
BG0509
REV. A2 17
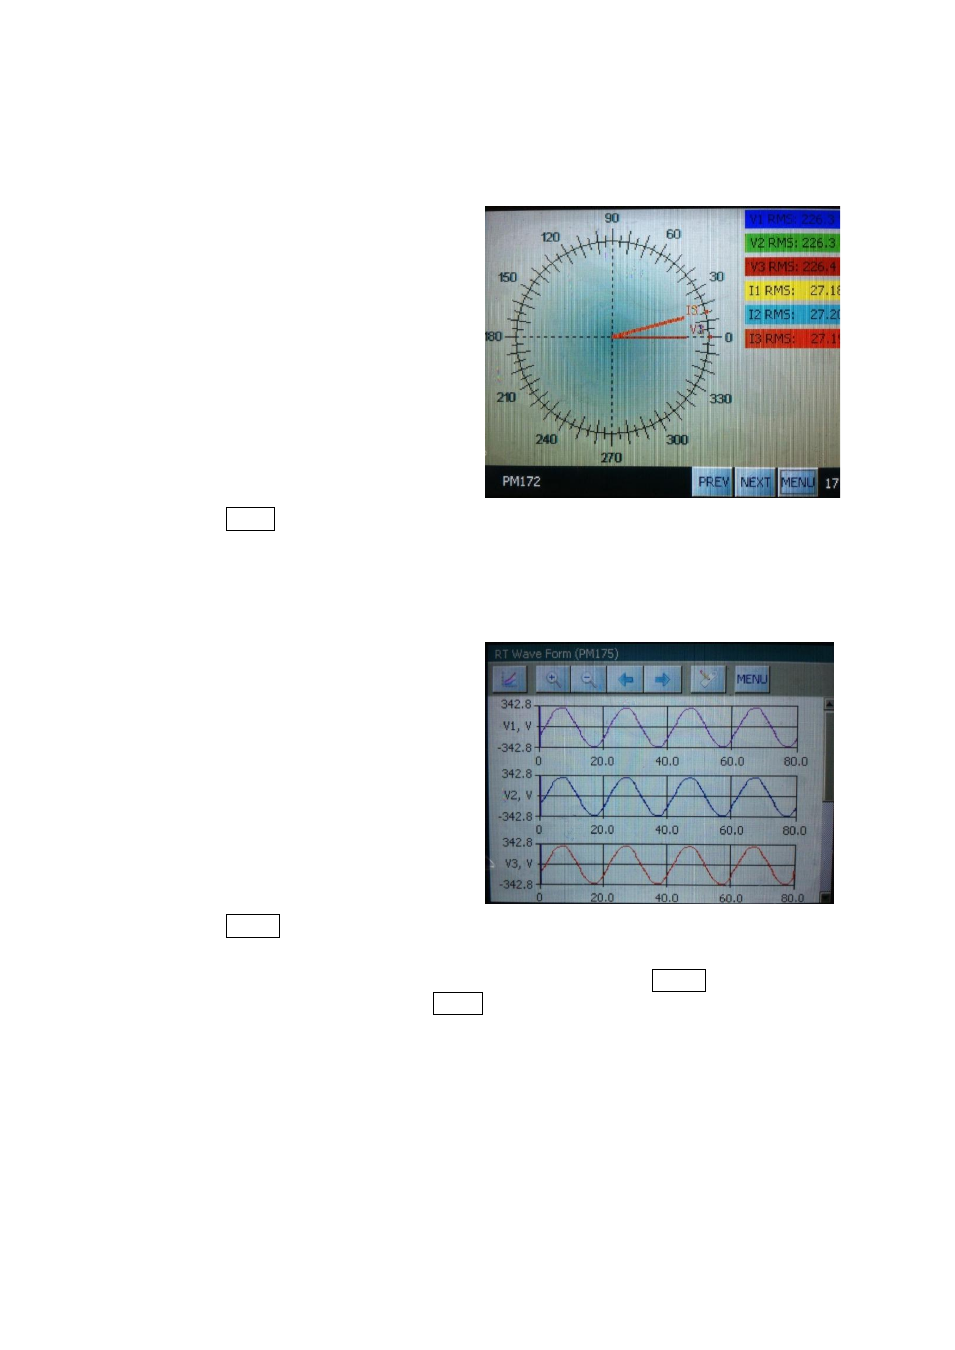
Phasor
The phasor is a graphical display of phase angles for voltage and
current per phase.
The phases are color coded for
easy reading of the graph.
Press NEXT to display the Waveform graph.
Waveform
The waveform is a real time graphical display.
Use the sliding bar on the right
to view different waveforms.
The icons at the top are (from
left to right):
- Channel selection
- Zoom
- View previous or next
section of the graph
- View waveform properties
Press MENU to close this screen. “Closing” will appear, after which you
will be back to the Real Time Measurement Data Menu (see 4.1).
From the Real Time Measurement Data screen, press MENU to display
the Select Data menu; press NEXT to display the Harmonic Data
Menu (see 4.2).