Cooper-Atkins GL300 User Manual
Page 14

Device Information Window
Displays information about the devices you have programmed with the current copy of the HACCP
Manager software. The display uses these headings:
Device Num:
A unique number associated with the device.
Device Name:
A name of up to 12 characters that appears on the device display.
You specify this name when you program the device.
F/C:
Whether temperatures appear in Fahrenheit or Centigrade on the
device display.
Probe:
Probe type (can be J, K or T).
Description:
A description of up to 40 characters. You specify this description
when you program the device.
Locked:
Whether or not this device is locked. That is, if the field user of the
device is prevented from making any setting changes.
Tenths:
Whether or not temperature display will include tenths of a degree in
the device display.
Temperature Data Window:
Displays data set information that you have downloaded from a device. The display is cumulative,
with each newly downloaded data set adding on to the end of the previous one. The display uses
these column headings:
Alarm:
Either an “H” or an “L” to indicate that the high or low alarm point has
been exceeded; or an * to indicate that the record represents a
calibration of the device.
Temp:
The temperature that was recorded.
Location:
The location or name assigned to the tab. For calibration records,
“Factory” indicates restoration of the factory settings and
“Calibrate” indicates calibration of the device in the field.
Date:
The date the temperature data was recorded.
Time:
The time the temperature data was recorded.
Data Set:
The number assigned to the data set by the HACCP Manager.
Point Num:
The data point number, incremented in the device after each
successive temperature record, starting with 1 for each data set.
Comment:
An optional comment field for data with alarms, makes a record of
how an alarm condition was handled.
Tab Number:
A unique number associated with the Tab.
The HACCP Manager displays in red any row that contains an alarm for which the “Action Taken”
has not yet been recorded. To record “Action Taken” or another memo...
•
Double click the row with the alarm. The “Actions Taken” dialog box appears.
•
Select a Corrective Action.
•
Enter your comments and click OK.
When you return to the “Temperature Data” window, the row will no longer be displayed in red.
IMPORTANT! Once you enter a description in the “Actions Taken” dialog box and click OK,
you cannot edit it at a later time.
IMPORTANT! An individual copy of the HACCP Manager software along with its associated
devices and tabs forms a functional set. You cannot program a device with one copy of the
software and then try to use it with another copy, even on the same computer. The same is
true for tabs. If you do try to use a single device or tab with multiple copies of the HACCP
Manager software, the results are unpredictable, and almost certainly confusing.
12
When you are sure all the settings in the window are correct...
•
Click on the Write settings to GL100 Tag button. A message window warns you are about to
change the settings in the GL100. Click on the Yes button to send the new settings to the
GL100. If you click on the No button you will cancel the programming operation. A message
indicates the programming was successful, and you return to the “Quick Steps” window.
Read Data from GL100
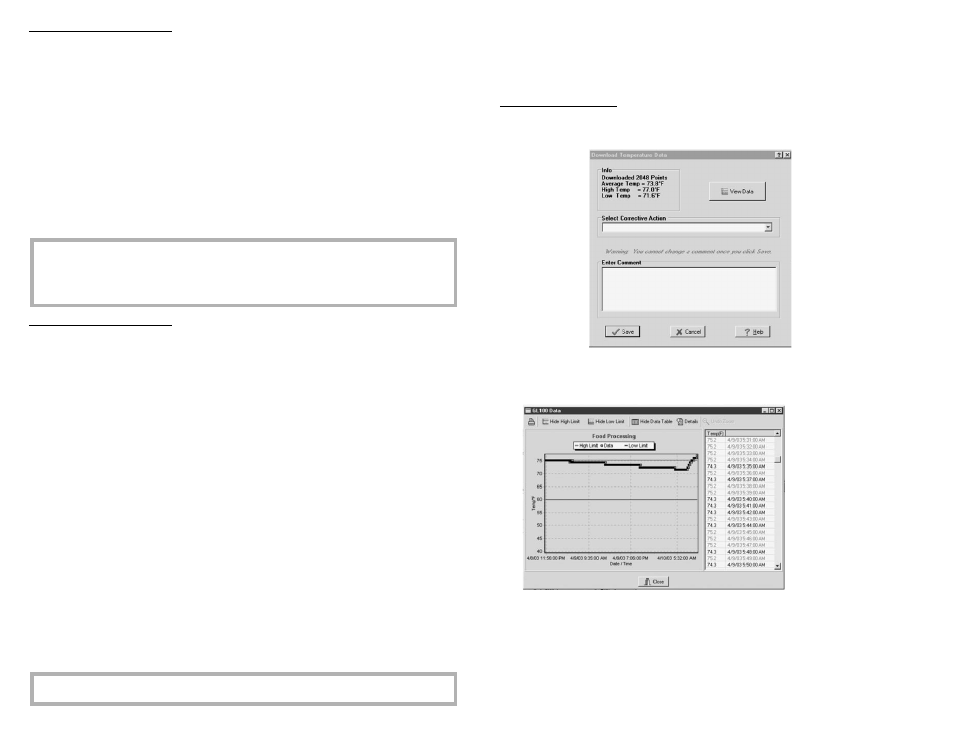
To transfer collected data from the GL100 to your computer, click on the Read Data From GL100
button of the “Quick Steps” window. The “Download Temperature Data” window will appear.
The info box displays
general information about
the data in the GL100.
•
Click on the View Data button to see a graph of the GL100 data before you save the data to
your computer. The “GL100 Data” window displays a graph of the data that is either in the
GL100, or that you have previously downloaded to your computer.
If you set high and low alarm
points in the GL100, the
graph will show a red line for
high, and a blue line for low.
You can click on the Hide
High Limit or Hide Low
Limit buttons to turn off
either one. If you have only
programmed one alarm point,
or no alarm point, then the
Hide button will be disabled
(grayed out).
•
Click on the Details button to see how many points are in the data set, and how many of those
points were above or below alarm points.
•
Click on the Details button again to hide the details panel.
•
Click on the Show Data Table button to see a listing of each data point in the data set,
including the temperature and the date and time of the record. Notice that any temperatures
that exceeded the high alarm point will have red text, and those that exceeded the low alarm
point will have blue text.
5
