5dps hglwru, 6shfli\lqj vfdoh – IKA labworldsoft User Manual
Page 39
- 39 -
5DPS HGLWRU
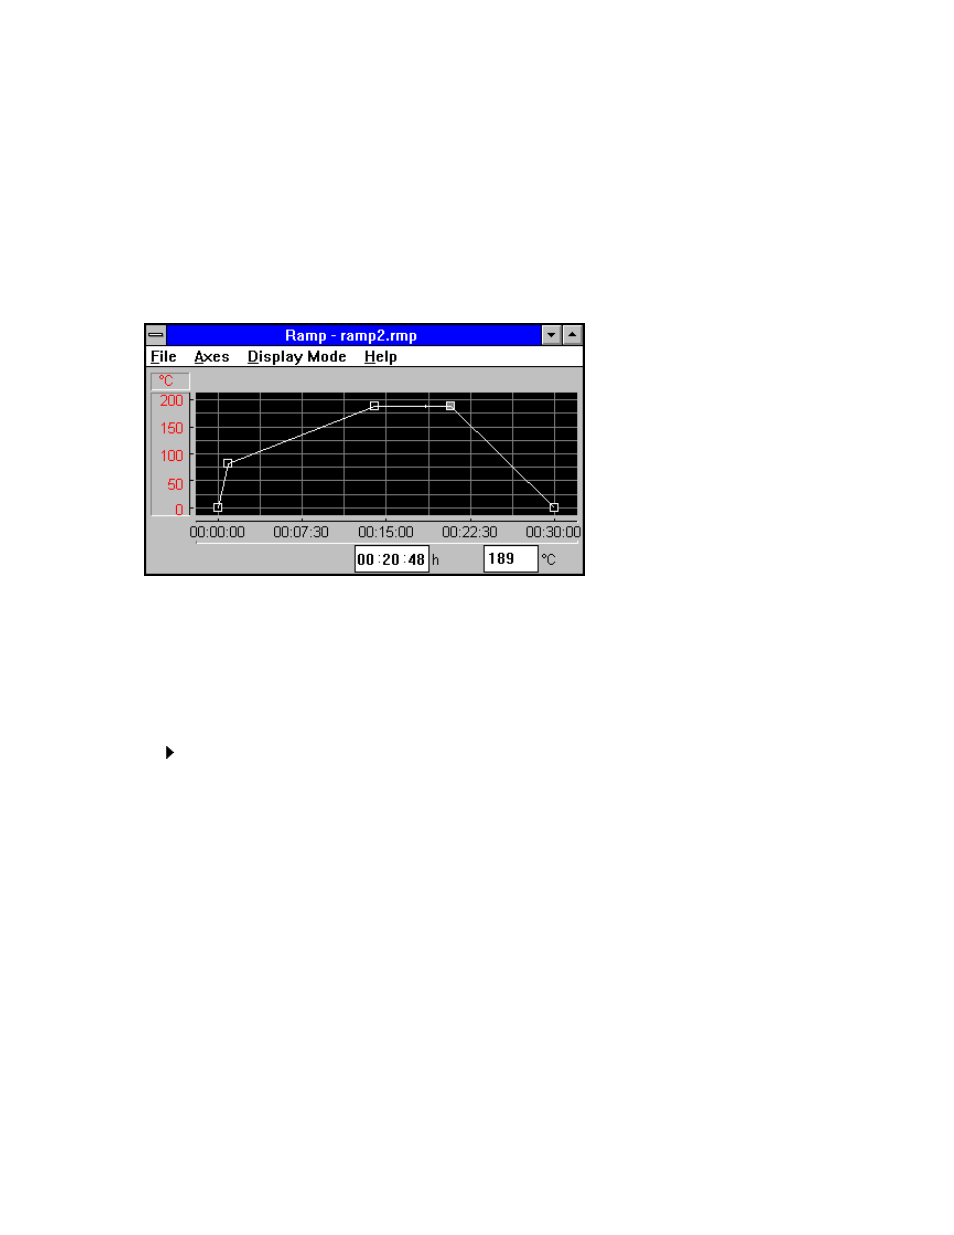
The illustration shows the ramp editor window with the graph field and the current scale. The ramp
function represents a temperature curve over a period of 30 minutes (basic setting). The y-axis can
assume various controlling variables (speed, temperature) with the corresponding value ranges, while
the time axis can be set over a broad range up to a maximum of one month.
A ramp is defined by a number of support points (small boxes) linked with lines. At the start of ramp
editing only the support points of the starting and stopping times are defined (linked with a straight
line). Other support points can be entered with graphic or numeric editing.
The parameter settings of the ramp editor are described under the following topics:
6SHFLI\LQJ VFDOH
Proceed as follows:
1. Open
$[HV
pulldown menu in the menu bar.
2. Click on
7LPH VFDOH
to open the dialog box for time entry.
3. Enter the desired sequence duration for the ramp function and confirm it with
2.
. The
entry is made in minutes (basic setting is 30 min.). The time scale appears in the format:
hh : mm : ss (hours, minutes, seconds).
4. Click on
to open the dialog box for the controlling variable (temperature, speed etc.) and the value range. 5. Enter the controlling variable by indicating the 8QLW in the appropriate field (e.g. °C for temperature). 6. Enter the upper and lower UDQJH OLPLWV in the corresponding fields \BPD[ , \BPLQ . 7. Confirm the entry with 2. . 8. The graph field is scaled with the current parameters.