Data graphs area, 3 data graphs area, Figure 3-3 direct reports data – HP Access Control User Manual
Page 11: Figure 3-4 data graphs area
To view printing information about a user in your Direct Reports, double-click a user name in the Direct
Reports section. The following happens:
●
This moves the user name up to the User(s) section. The User(s) section now displays the hierarchy of
users.
●
Information about that user’s printing history displays in the data visuals and data grid sections on the
right.
●
The Direct Reports section also changes to display the names of users who report directly to the user
selected.
Figure 3-3
Direct reports data
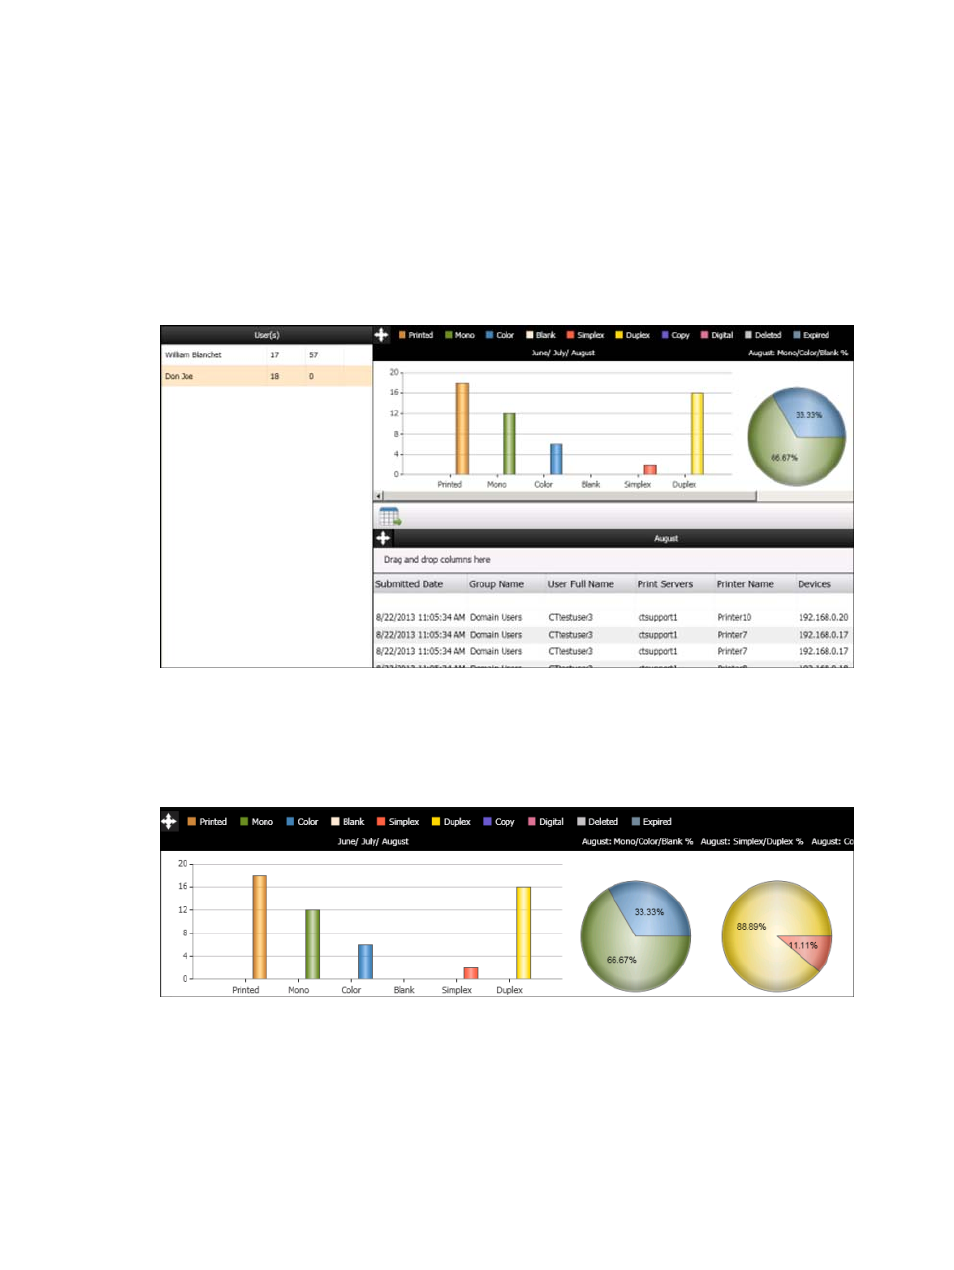
3.1.3 Data graphs area
The information displayed in the data visuals section shows the current and previous two month’s printing
data related to the last user listed in the User(s) section.
Figure 3-4
Data graphs area
The data visuals section displays two types of visual: a bar graph and pie charts.
●
The bar graph illustrates the user’s printing data over the past three months, including the total number
of pages print, the total number of mono pages printed, the total number of colored pages printed, the
total number of simplex pages printed, and the total number of duplex pages printed. Each bar
represents the number of pages printed for each month.
●
The pie charts show the user’s printing data for the current month.
Section 3.1 Default Dashboard
7