A.3 throughput scaling, Writes slow when cache fills – HP StorageWorks Scalable File Share User Manual
Page 50

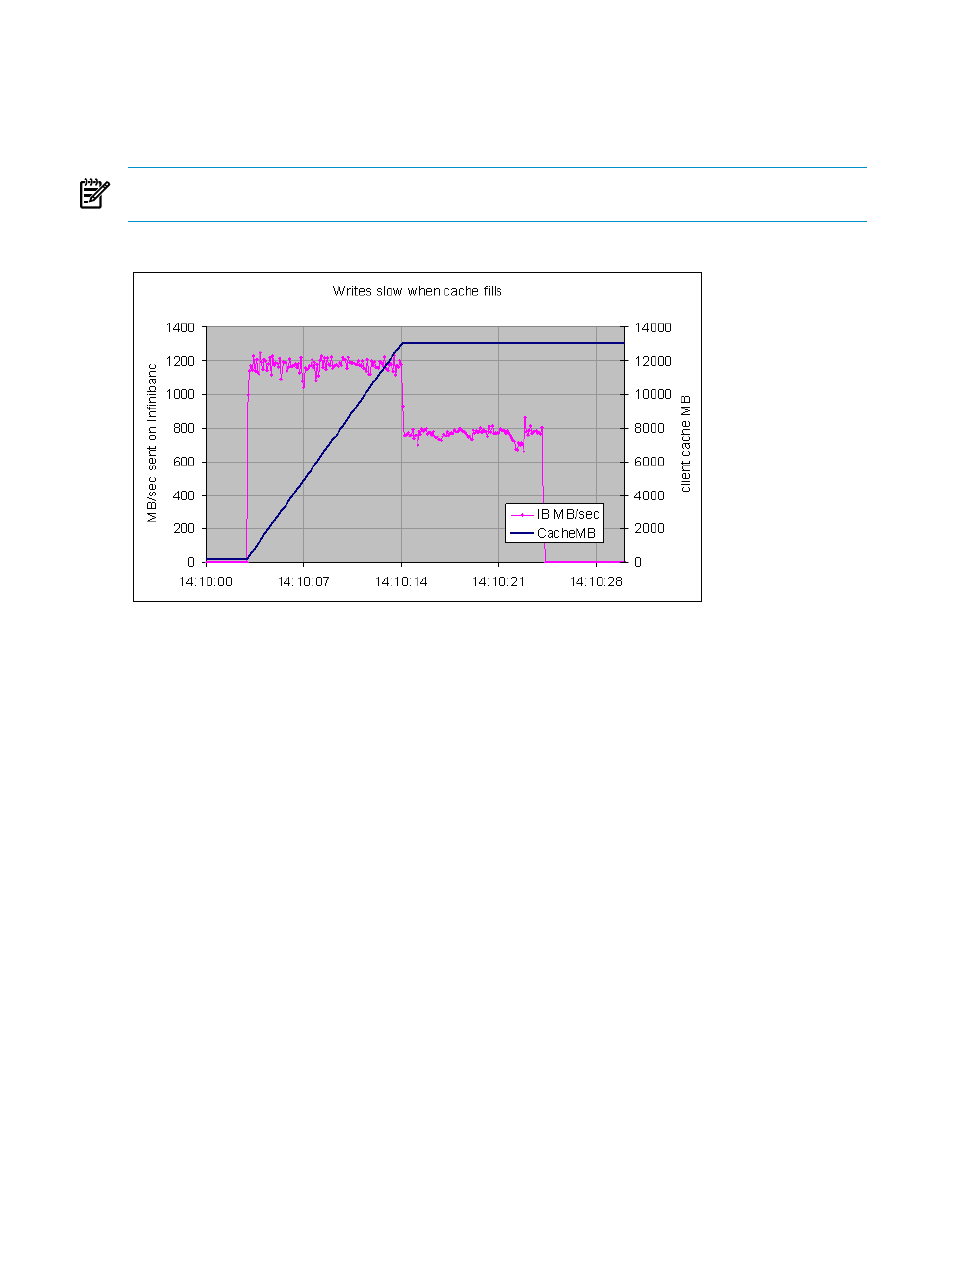
The test shown in
did not use direct I/O. Nevertheless, it shows the cost of client cache
management on throughput. In this test, two processes on one client node each wrote 10GB.
Initially, the writes proceeded at over 1.0GB per second. The data was sent to the servers, and
the cache filled with the new data. At the point (14:10:14 in the graph) where the amount of data
reached the cache limit imposed by Lustre (12GB), throughput dropped by about a third.
NOTE:
This limit is defined by the Lustre parameter max_cached_mb. It defaults to 75% of
memory, and can be changed with the lctl utility.
Figure A-5 Writes Slow When Cache Fills
Because cache effects at the start of a test are common, it is important to understand what this
graph shows and what it does not. The MB per second rate shown is the traffic sent out over
InfiniBand by the client. This is not a plot of data being dumped into dirty cache on the client
before being written to the storage servers. (This is measured with collectl -sx, and included
about 2% overhead above the payload data rate.)
It appears that additional overhead is on the client when the client cache is full and each new
write requires selecting and deallocating an old block from cache.
A.3 Throughput Scaling
HP SFS with Lustre is able to scale both capacity and performance over a wide range by adding
servers.
shows a linear increase in throughput with the number of clients involved and the
number of OSTs used. Each client node ran an IOR process that wrote a 16GB file, and then read
a file written by a different client node. Each file had a stripe count of one, and Lustre distributed
the files across the available OSTs so the number of OSTs involved equaled the number of clients.
Throughput increased linearly with the number of clients and OSTs until every OST was busy.
50
HP SFS G3.0-0 Performance
