Seca Analitics 115 User Manual
Page 43
Operation • 43
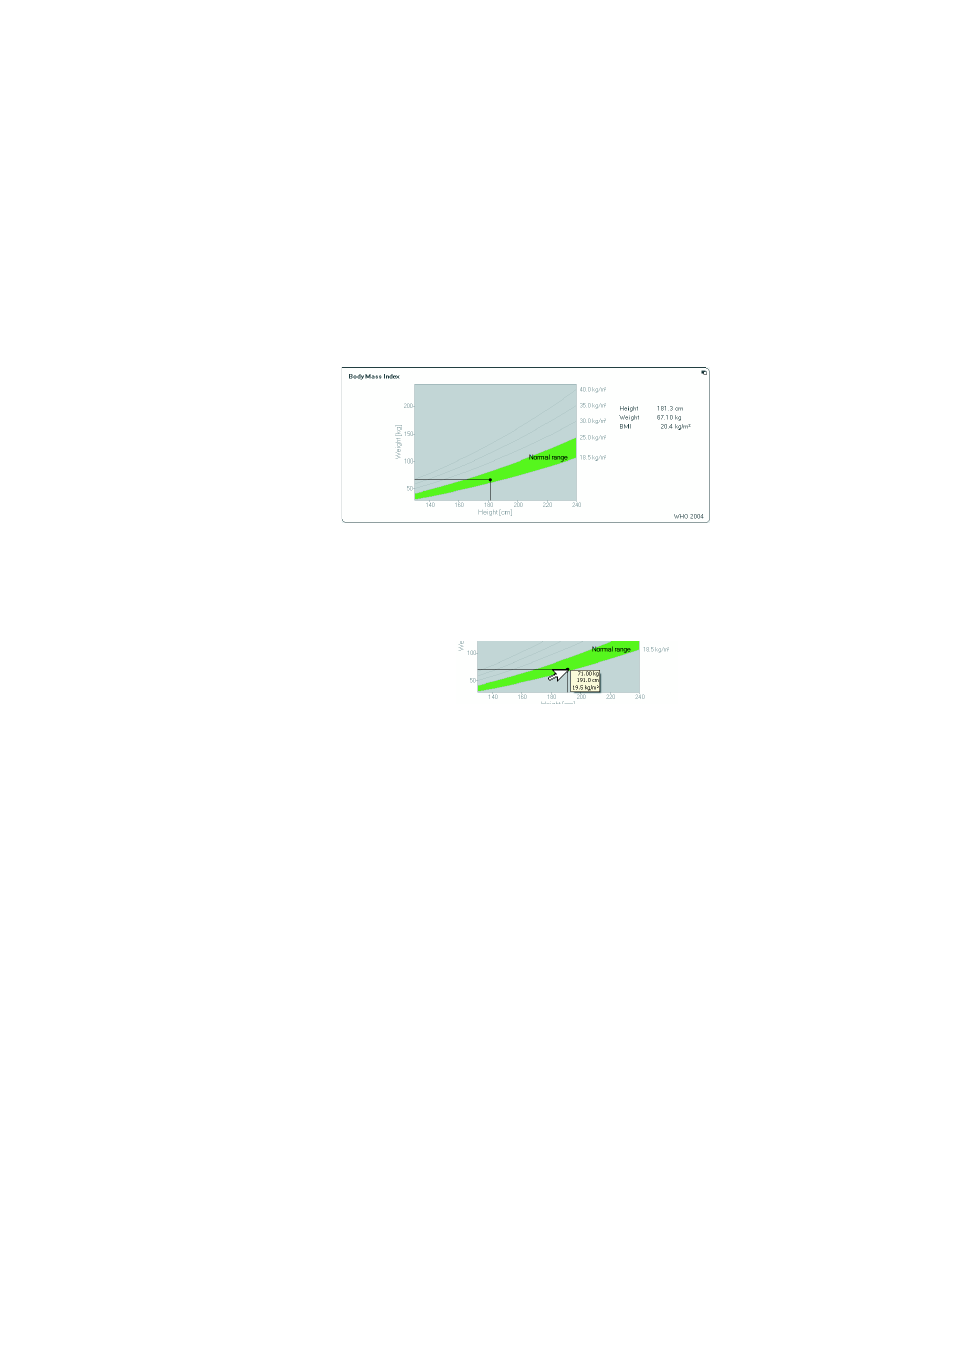
1. Click on a graphic in order to display it enlarged
and with details (here: BMI).
2. Click on the graphic again in order to shrink it back
to its original size.
NOTE:
If you position the mouse pointer on a
measurement point in the graphic, the
associated measurement values will be
displayed.
Viewing the history
You can view a patient's history by selecting several
measurements. Measured results and evaluations are
then displayed in progression graphs.
NOTE:
This function is not available in the modules
Cardiometabolic risk
and
Raw data for
impedance
since in these modules a
progression display is not relevant for
assessment of the patient's state of health.
Proceed as follows to select measurements for the
history:
1. Click the
Results of examination
tab.
2. Click on the module that you want to display.
The module is displayed in a selection bar.
3. Click on the one of the measurements you wish to
select.
The measurement is displayed on a selection bar.