10 output .txt file (analyzing), 11 trend output (analyzing), 13 spot size calculator – LumaSense Technologies ISR 320 User Manual
Page 30
ISR 320 Manual
Software InfraWin 30
frequency that readings were taken (settings at 5.9 PC sampling rates). As the amount of data
increases, so does the amount of storage space required to save it. In order to save room, all .i12
data files are stored by a binary code.
5.10 Output .TXT file (analyzing)
The same file as under Output listing may be converted into a text file and
can be easily opened, for example with Microsoft Excel. With the standard
import settings, Excel automatically formats the columns accordingly (with tabs as separators).
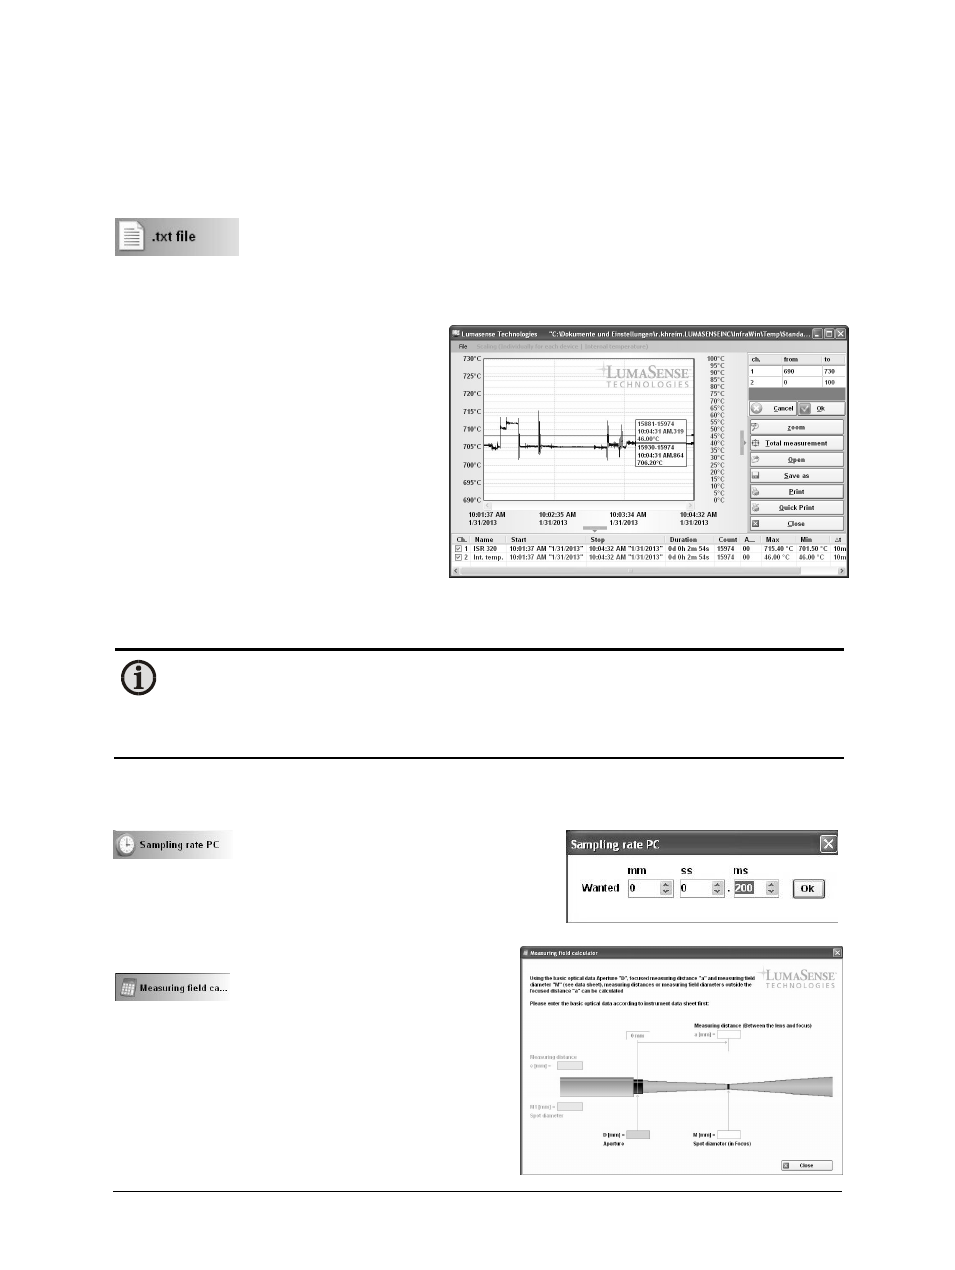
5.11 Trend output (analyzing)
The graph’s curve depicts the temperature
change over time within the specified
temperature range.
Additionally, other information appears in
this window; such as recorded time (x-axis)
and temperature in degrees (y-axis) as
well as the time and temperature at the
vertical cursor line which can be dragged
with the mouse.
Selecting the Trend output initially causes
all the saved data to be displayed.
If the data exceeds an amount that can be
reasonably represented, you may “Zoom“ in on a partial segment using the mouse (such as the
segment represented in the example). Under “Total” you can return to the representation of
the entire curve.
Note: The last reading is saved in the standard.i12 file and automatically appears in
this form upon opening Listing or Trend output.
Selecting file open with another file, the previous file will be overwritten and re-
placed by the standard.i12 file.
5.12 PC sampling rate (time interval between two
measurements)
This function sets a time interval. After
each interval, one measured value is
stored on the PC. Longer time intervals will result in
creating smaller stored file sizes. This function is mainly
used for long term measurements.
5.13 Spot size calculator
The InfraWin Spot Size Calculator
calculates the data for the non-
focused regions. To calculate data, enter the values
of aperture D, focused measurement distance a,
and focused measuring field diameter M as found
in the documentation relating to the optics
supplied with your specific pyrometer.