Table 6 – PASCO ME-9426A AMUSEMENT PARK PHYSICS User Manual
Page 16
Amusement Park Physics
012-03776E
12
3. How does the starting acceleration compare with the stopping acceleration? Was it the same during the ascent
as it was during the descent?
4. Were the acceleration values constant during any of the periods of acceleration, or did they vary? How did
they vary? Were they all the same pattern?
5. How did you feel in each of the situations where you took readings? Compare your feelings with the
accelerometer readings.
Mathematical
If instructed, take a new set of readings, adding in the time for which each interval to occur, the distance over
which it occurred and the net acceleration.
Questions
1. What was the average speed going up?
2. What was the average speed going down?
3. Use your acceleration values and times to calculate distances for each of the accelerations. How do your
calculated values compare with the ones measured (or estimated)?
4. What was your average speed during the periods where you were moving at a constant speed?
Use your data to construct a distance vs time and a velocity vs time graph.
6. Do these graphs accurately reflect the motion you experienced on the elevator? Explain your feelings at different
places during the experience.
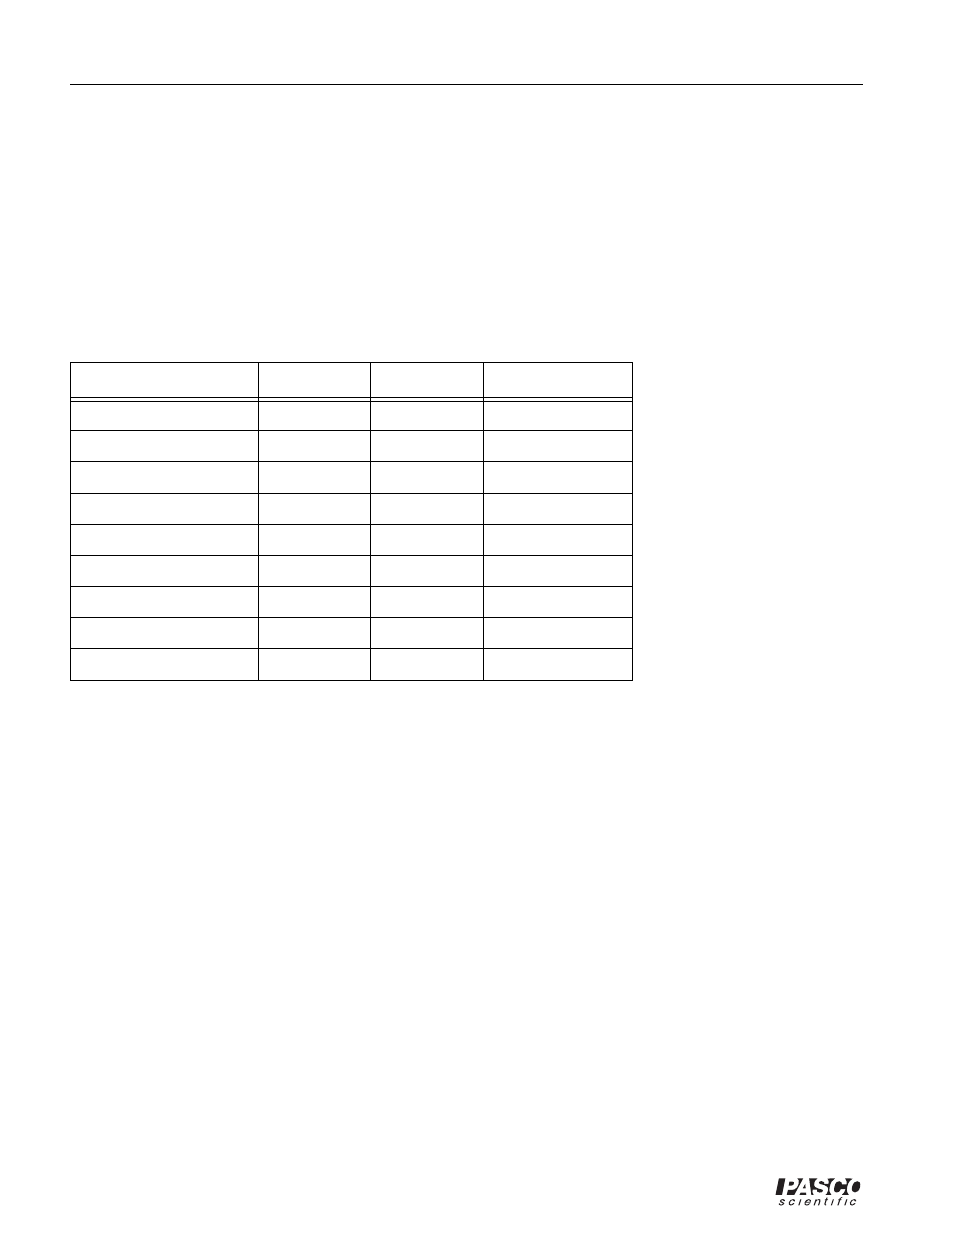
Table 6:
Time
Distance
Net Acceleration
Standing still
Beginning ascent
Middle of ascent
Slowing ascent
Stopped
Beginning descent
Middle of descent
Slowing descent
Stopped