Pre-lab exercise – PASCO SE-9076 Constant Velocity Tubes User Manual
Page 19
15
Constant Velocity Tubes
012–06697B
Pre-lab Exercise
Answers to questions
1. Other potential variables that should be held constant include the container (could be a
different mass), the pan balance used (might not be properly calibrated, or calibration methods
could be crude), two different methods of measuring the liquid (eg beaker vs. graduated
cylinder), or ambient temperature.
2. Plotting the extremes allows one to begin the graphing process with the assurance that all
data will fit on the graph and to more accurately guess the slope of the true line that represents
the relationship between the variables (assuming it is a linear relationship).
5. Answers will vary.
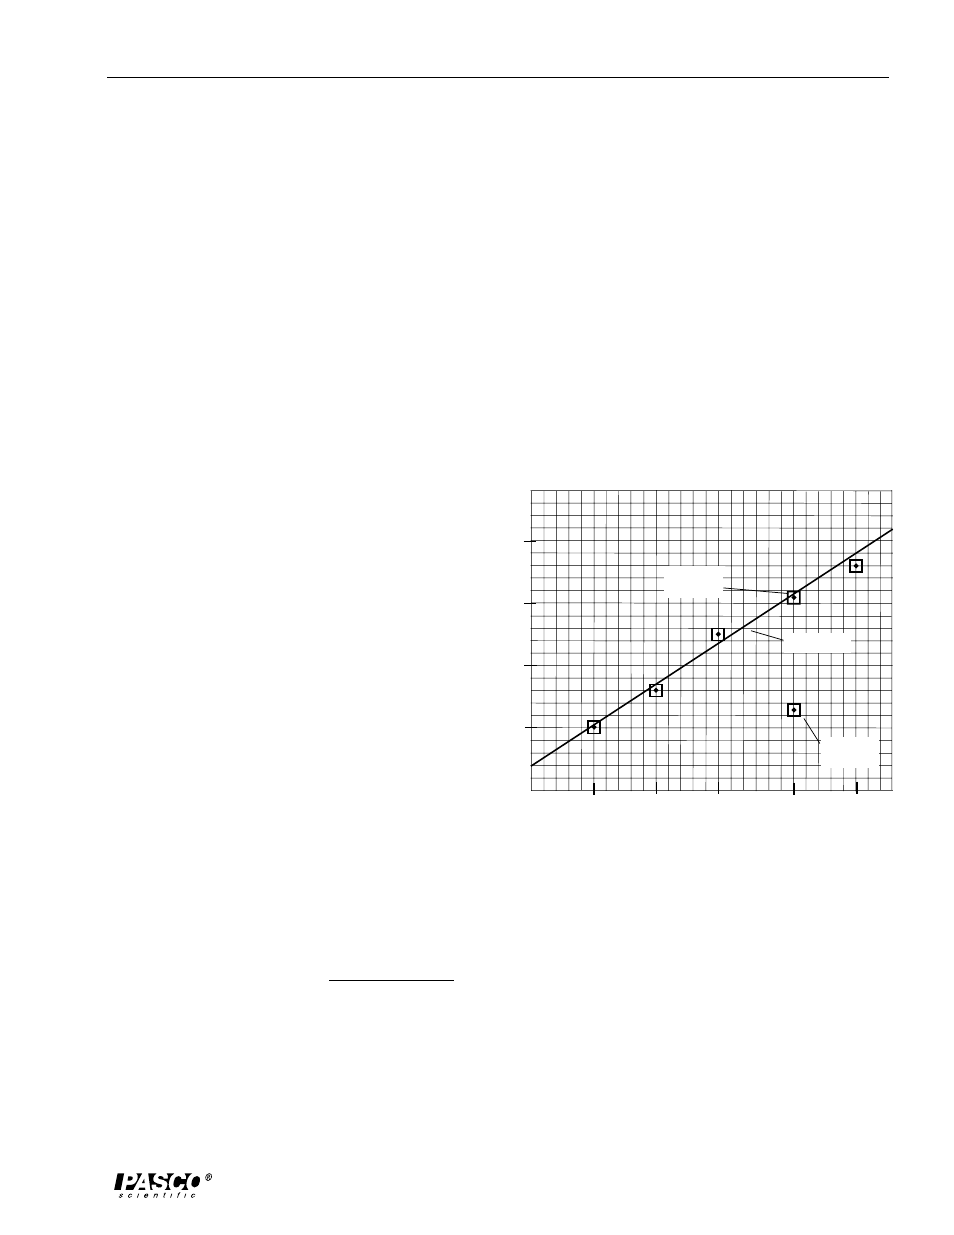
7. the 200 ml, 1300 g point
10. mass = m • volume + b
11. mass = m • volume + 360 g
12. Answers will vary around 360 g.
13. a)
y
1
= 1640 g
x
1
= 100 ml
y
2
= 3675 g
x
2
= 250 ml
(Answers will vary somewhat.)
b)
y
2
- y
1
= 2035 g
x
2
- x
1
= 150 ml
(Answers will vary somewhat.)
c)
13.6 g/ml
(Answers will vary somewhat.)
d)
mass (g) = 13.6 g/ml • volume (ml) + 360 g
14.
15. The y-intercept equals the mass of the beaker.
16. The slope represents the density of the liquid mercury. The accepted value for the density
of mercury is 13.5 g/ml (room temperature) or 13.6 g/ml at 0 °C.
volume (ml)
50
100
150
200
250
1000
2000
3000
4000
mass (g)
Teacher’s Notes
volume (ml) =
mass (g) – 360 g
13.6 g/ml
Graph of Plotted Data
best-fit line
corrected
data point
mistaken
data point