Sample data, Resistance to temperature conversion – PASCO TD-8580A Thermal Cavity User Manual
Page 7
®
Model No. TD-8580A
Sample Data
7
Sample Data
DataStudio files containing these data can be found on the included CD-ROM.
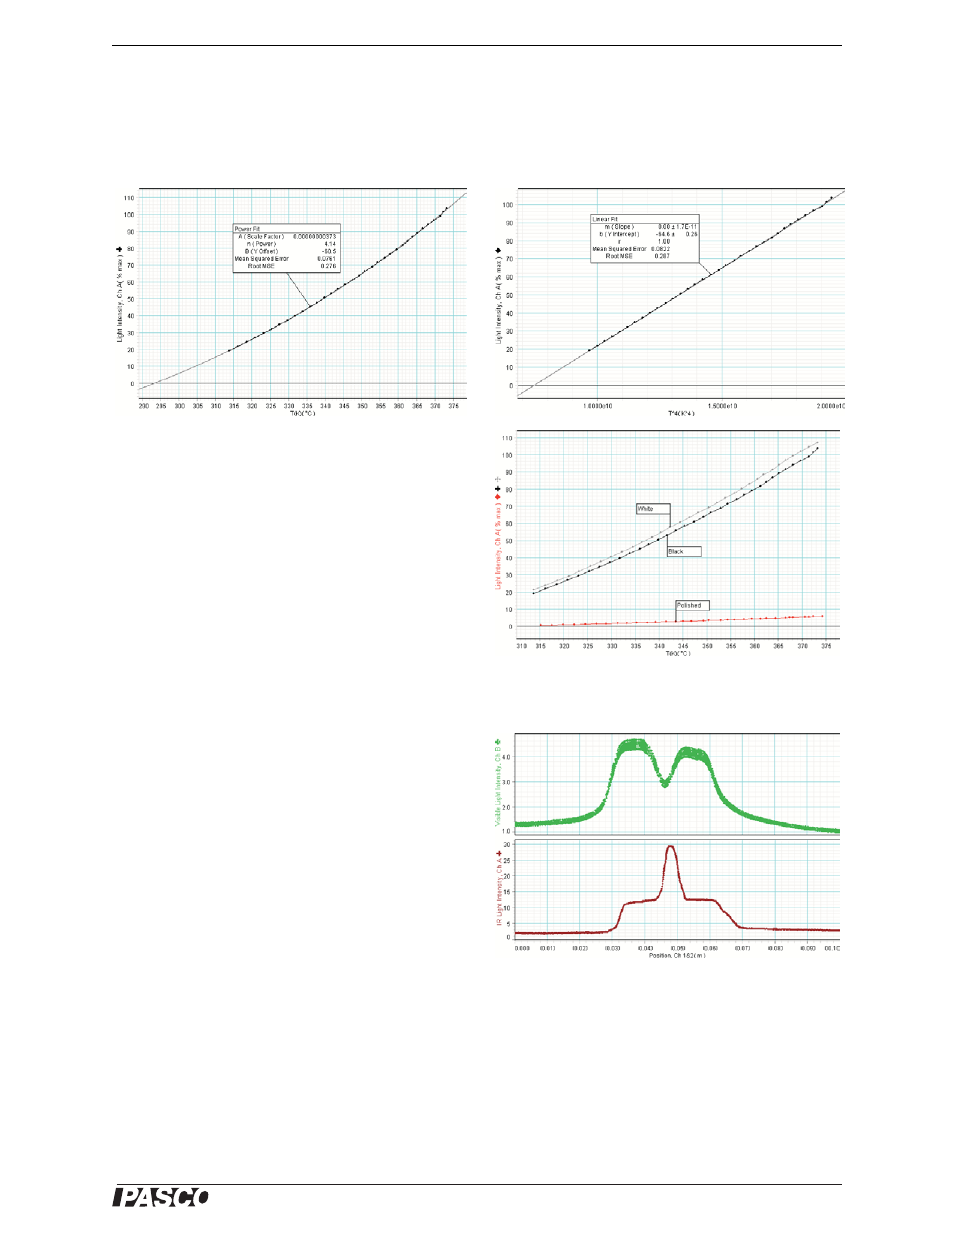
Infrared Light Intensity versus Temperature
The graphs above show I versus T (above left) and I
versus T
4
(above right) for the black surface. The
curve fit applied to I versus T is
; note
that the curve intersects the horizontal axis at
, the approximate temperature of
the sensor.
The graphs of I versus T for the different surfaces of
the cube (right) show that the black and white surfaces
have similar emissivities in the IR region of the spec-
trum, and the emissivity of the polished surface is
much lower.
Reflected Visible Light and Emitted Infrared Light
These graphs show visible light intensity versus posi-
tion (top right) and IR light intensity versus position
(bottom right) at 92 °C. In the visible region of the
spectrum, the cavity is darker than the surrounding
cube surface; in the IR region the cavity is brighter.
Resistance to Temperature Conversion
To find the temperature (T) measured in kelvin based on the resistance
(
R
)
of the
embedded thermistor measured in k
Ω
, use the formula:
I
A
T
n
×
B
+
=
T
294 K
21
°
C
=
=
1
T
---
A B
R
10
------
ln
⋅
C
R
10
------
ln
2
⋅
D
R
10
------
ln
3
⋅
+
+
+
=