Expanded programs – Hach-Lange DR 3900 User Manual User Manual
Page 96
96
Expanded programs
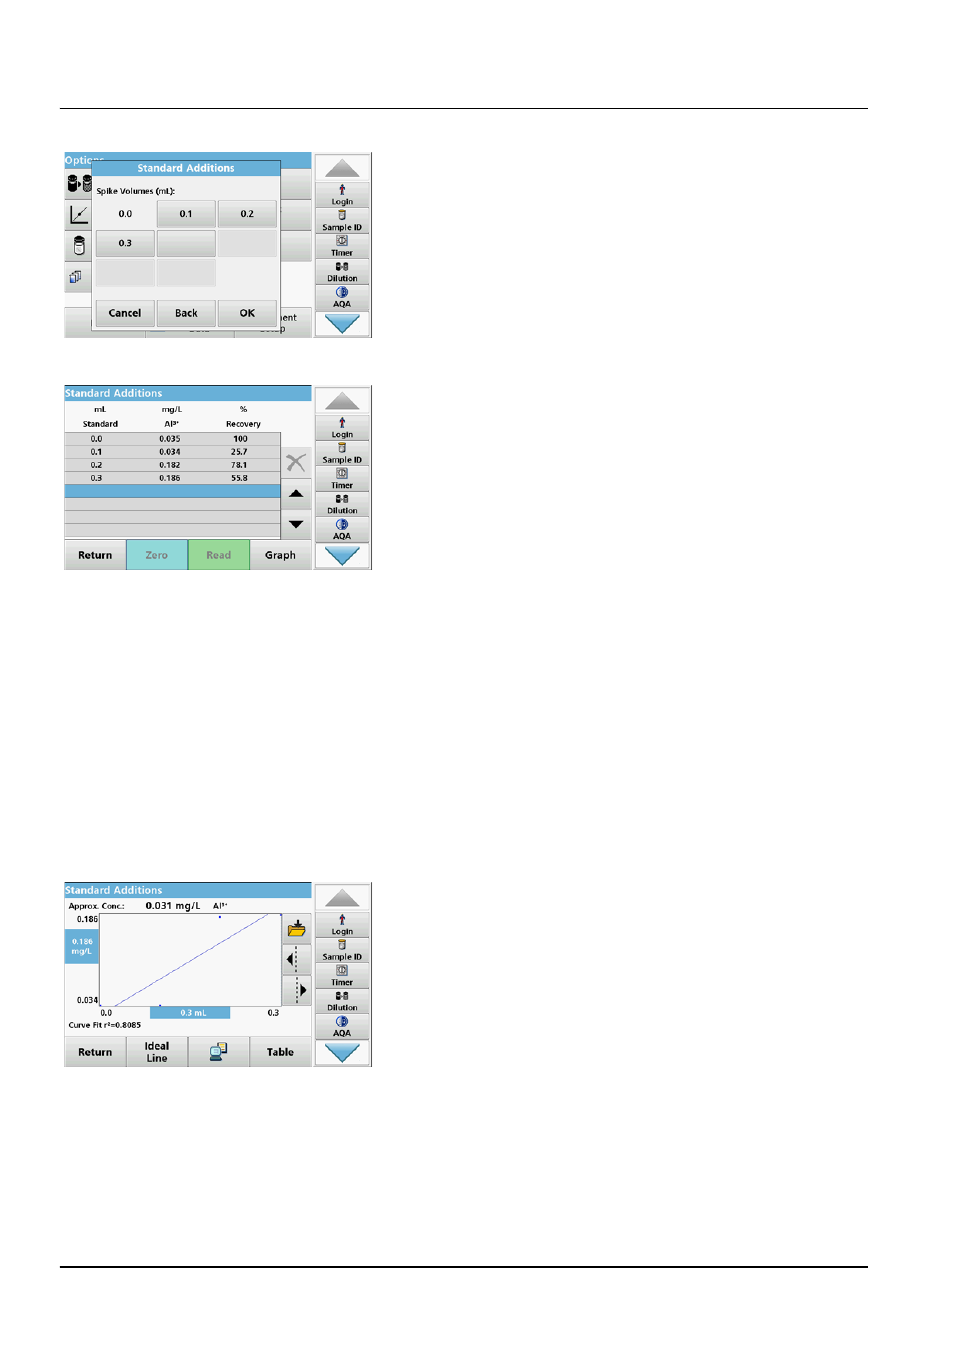
10. Press the keys to change the standard addition volumes.
Use the alphanumeric keypad to enter the new data.
11. Press OK to confirm.
Description of the table of readings
•
The first column shows the standard addition volume. 0 ml
stands for a sample containing no added standard.
•
The second column shows the reading of the samples with
and without added standard.
•
The third column shows the detection rate of the added
standard.
Note: The black highlighted line is active.
The reading of the sample in the instrument, without added
standard, is automatically shown under 0 mL.
12. Prepare the standard addition solution as described in the
procedure.
13. Press the standard addition volume in the table.
14. Insert the cell with the respective addition volume into the
cell compartment.
15. Press Read.
Repeat the procedure with all the other standard addition
solutions.
16. After all the standard addition solutions have been
measured, press Graph.
The regression line through the standard addition data points
is displayed.
The correlation coefficient r
2
indicates how close the data
points are to the line.
If the correlation coefficient = 1, the curve is linear.
The concentration shown above the curve is the estimated
concentration of the sample without the added standard.
Note: In the Graph menu, the name on the Graph key switches to
Table. Press Table to display all the data in the table again.
17. Press Ideal Line to display the relationship between the
additions and the ideal line (detection rate 100 %).