Expanded programs – Hach-Lange DR 3900 User Manual User Manual
Page 79
79
Expanded programs
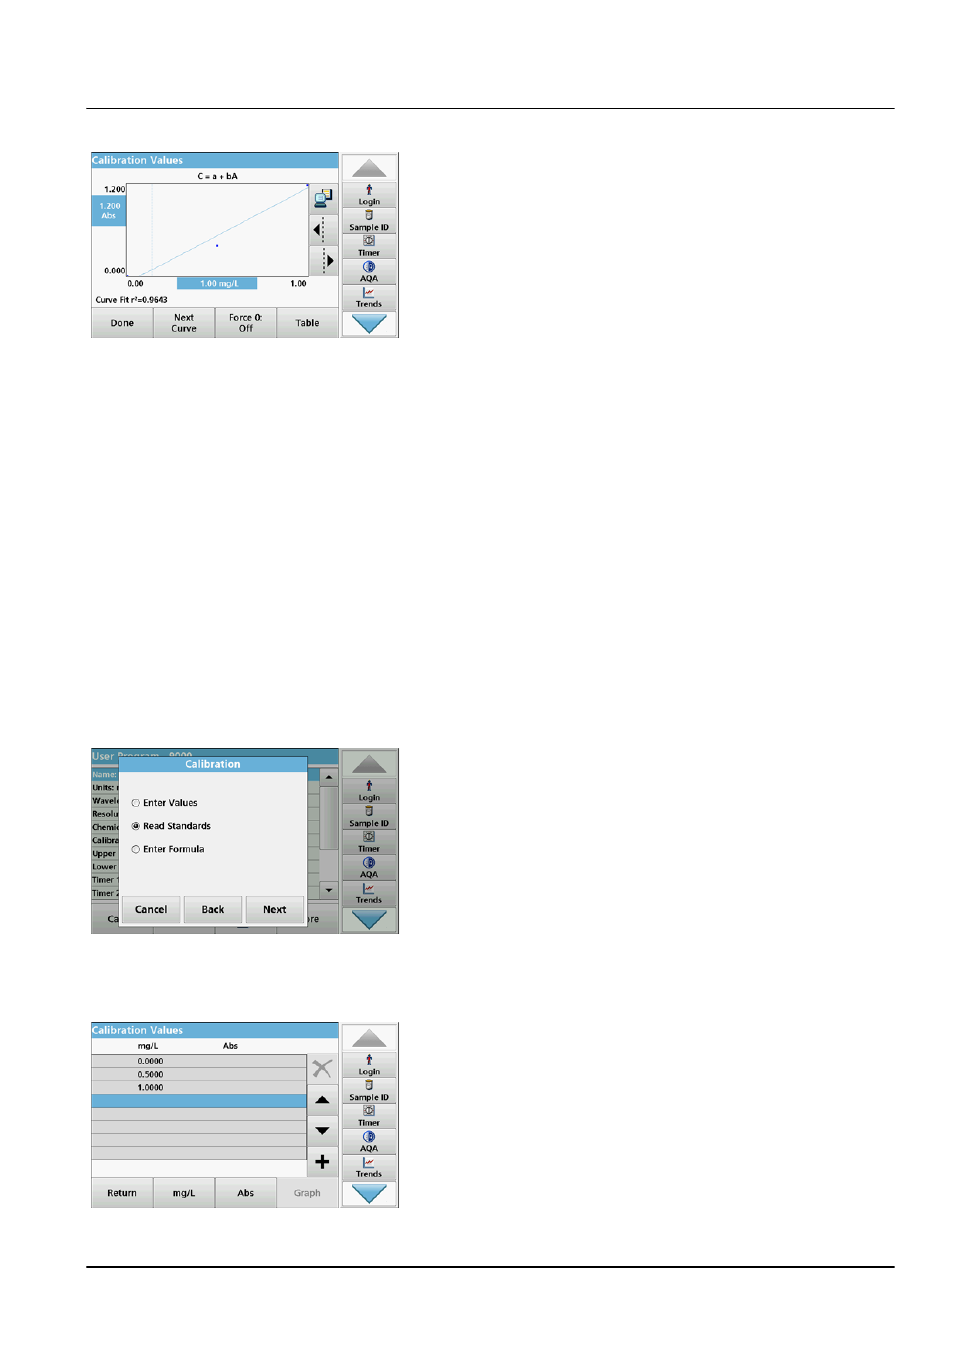
9. Press Graph.
The entered data is shown as a calibration curve.
Note: The correlation coefficient (r
2
) is shown on the left below the
axes.
The linear equation corresponds to the standard setting.
10. Press Next graph.
The presentation changes to polynomial curve of the second
order.
11. Press Next graph.
The presentation changes to polynomial curve of the third
order.
12. Press Force 0 to change the setting from Off to On. The
curve then passes through the origin of the coordinate
system.
Note: This may have an adverse effect on the correlation
coefficient (r
2
).
13. Press Table to return to the values table.
14. When the table has been completed and the curve type has
been chosen, press Done when the graph is displayed or
Exit when the table is displayed. Go to
.
Calibration using "Measure standards"
1. Press Measure standards.
2. Press Continue.
3. Press +.
4. Enter the standard concentration.
5. Press OK to confirm.
6. If necessary, repeat until all values have been entered. A
maximum of 24 values can be entered.
Note: To change a value in the table, mark the corresponding row.
Press the key of the unit (e. g. mg/L). Enter the changed value.
7. Insert the zero solution into the cell compartment.
8. Press Zero.
9. Mark the row with the first standard concentration and insert
the respective cell.
10. Press Read.
11. If necessary, repeat until all standard solutions are
measured.