Expanded programs – Hach-Lange DR 3900 User Manual User Manual
Page 80
80
Expanded programs
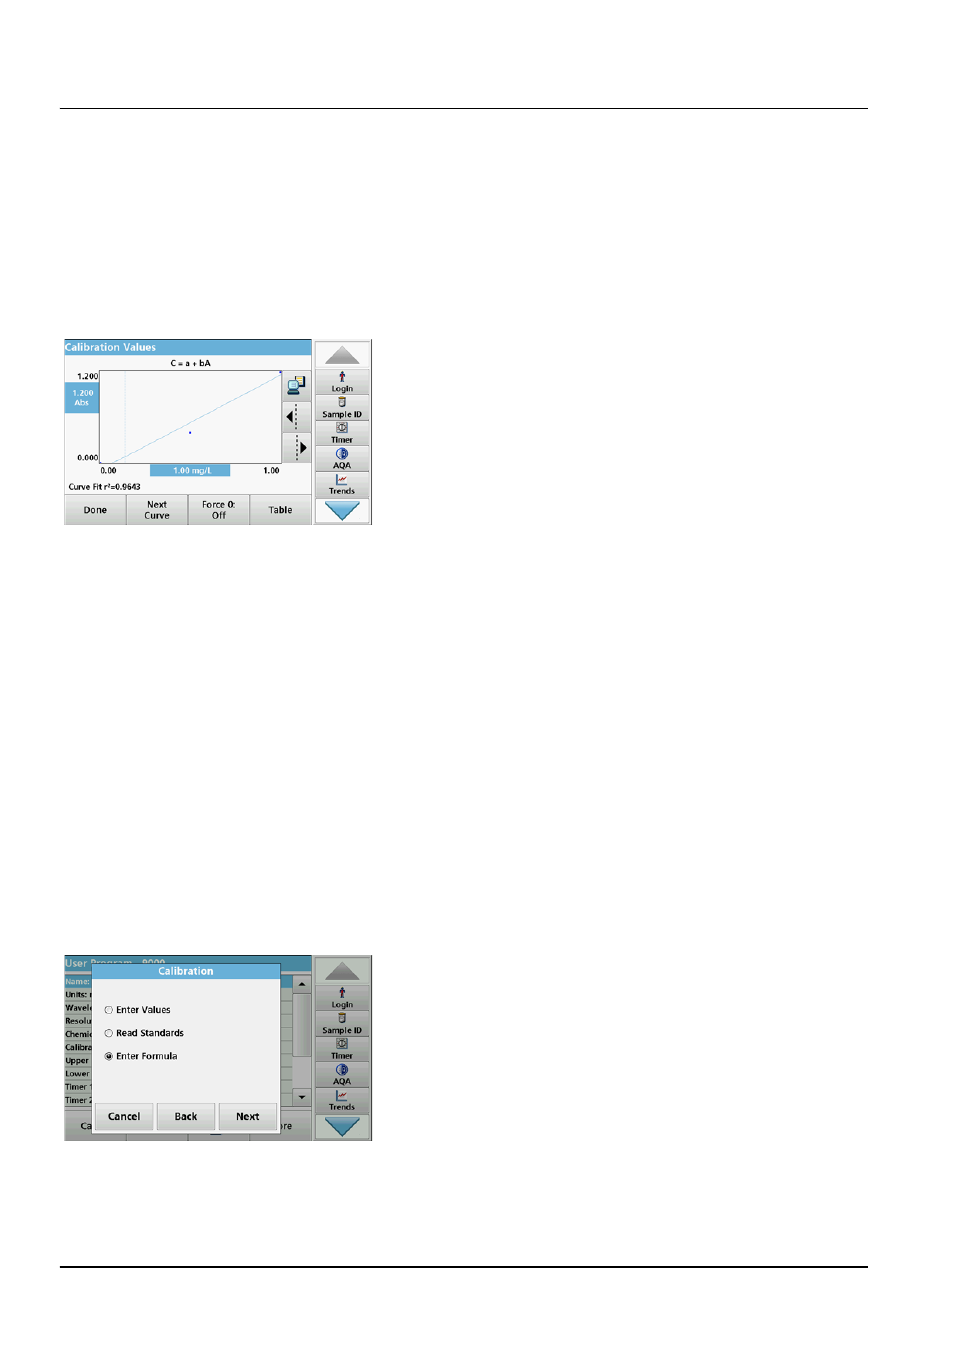
The entered and measured data is shown in the table.
Note: To delete a standard concentration, highlight the appropriate line
and press the Delete icon.
The timer icon shown in the display helps to make sure, when
necessary, that the steps of an analysis are correctly timed (e. g.
reaction times, wait time, etc., can be exactly specified). When
the specified time has elapsed, an acoustic signal is emitted. The
use of the timer has no influence on the reading program.
12. Press Graph.
The entered and measured data is shown as a calibration
curve.
Note: The correlation coefficient (r
2
) is shown on the left below the
axes.
The linear equation corresponds to the standard setting.
13. Press Next graph.
The presentation changes to polynomial curve of the second
order.
14. Press Next graph.
The presentation changes to polynomial curve of the third
order.
15. Press Force 0 to change the setting from Off to On. The
curve then passes through the origin of the coordinate
system.
Note: This may have an adverse effect on the correlation
coefficient (r
2
).
16. Press Table to return to the values table.
17. When the table has been completed and the curve type has
been chosen, press Done when the graph is displayed or
Exit when the table is displayed. Go to
Calibration using "Enter formula"
1. Press Enter formula.
2. Press Continue.